
Image
|
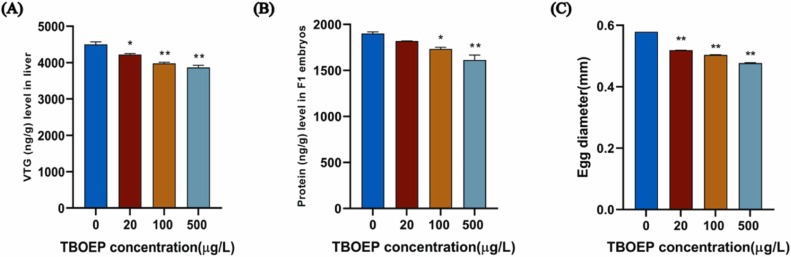
Figure Caption
Fig. 5 The content of vitellogenin in F0 female zebrafish livers (A), the protein content of offspring embryos of female zebrafish (B) and egg diameter (C). The findings are displayed as mean ± SEM. (n = 3). The difference between the test and control groups is denoted by *p < 0.05, * *p < 0.01.
Acknowledgments
This image is the copyrighted work of the attributed author or publisher, and
ZFIN has permission only to display this image to its users.
Additional permissions should be obtained from the applicable author or publisher of the image.
Full text @ Ecotoxicol. Environ. Saf.