
Image
|
Figure Caption
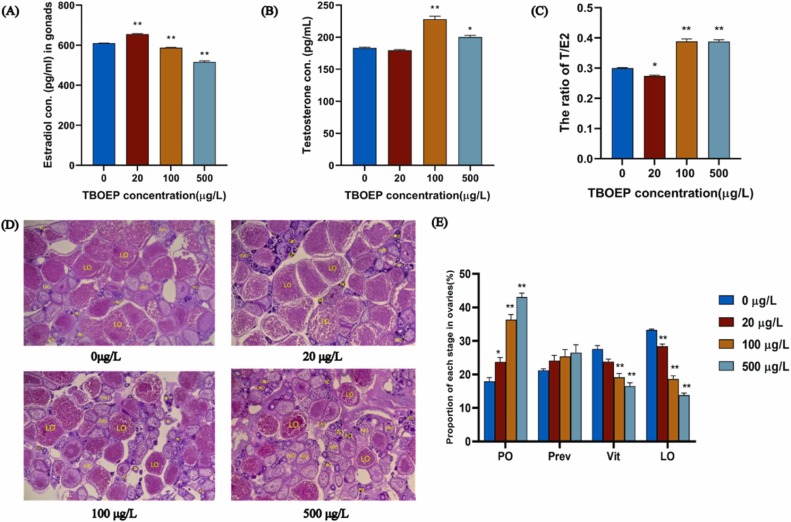
Fig. 2 Impact on serum E2 (A), T levels (B), the ratio of T/E2 (C), representative images of gonad sections from female zebrafish (D) and the ratio of different phases in gonads of female zebrafish (E) following exposure to 0, 20, 100, 500 µg/L TBOEP. The findings are displayed as mean ± SEM. (n = 6). *p < 0.05 and * *p < 0.01 signify notable disparities between the test and control groups.
Acknowledgments
This image is the copyrighted work of the attributed author or publisher, and
ZFIN has permission only to display this image to its users.
Additional permissions should be obtained from the applicable author or publisher of the image.
Full text @ Ecotoxicol. Environ. Saf.