
- Title
-
Microenvironment Mechanical Torque from ZnFe2O4 (ZFO) Micromotors Inhibiting Tumor Migration
- Authors
- Jiang, T., Feng, Y., Gao, C., Jiang, J., Chen, B., Liu, S., Du, D., Ding, M., Rong, J., Liao, Z., Li, W., Wilson, D.A., Tu, Y., Song, S., Wang, Y., Peng, F.
- Source
- Full text @ Adv. Mater. Weinheim
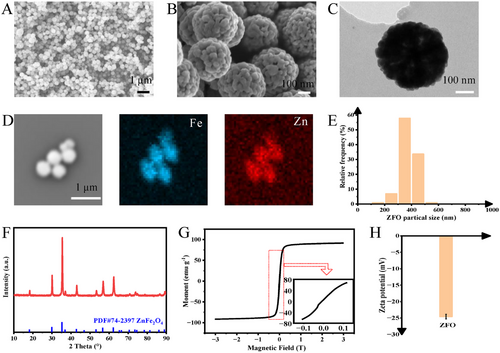
Characterization of ZFO. A,B) SEM images of ZFO. Scale bars: 1 µm (A) and 100 nm (B). C) TEM image of ZFO. Scale bar: 100 nm. D) Elemental mappings of ZFO. Scale bar: 1 µm. E) Particle size distribution histogram of ZFO from SEM. The particle number was 116. F) XRD pattern and G) magnetic hysteresis loops of the as-prepared ZFO. H) Zeta potential of ZFO in deionized water. |

Magnetic self-assembly of ZFO. A) The schematic diagram of magnetic self-assembly processes of ZFO. B–G) The images of ZFO in 5% glucose solution at the concentration of 10 µg mL−1, without magnetic field, under static magnetic field (2 mT) for 1, 5, 10, and 20 min, and after removing the magnetic field. The inset at the top right corner of (B–F) are the trajectories of the particle under the corresponding condition. H) Length distribution histogram of ZFO chain (10 µg mL−1) under static magnetic field (2 mT) for different self-assembly times (y axis: 0, 1, 5, 10, and 20 min). I) Length distribution histogram of ZFO chain under magnetic field (2 mT) for 10 min with the different ZFO concentration (y axis: 5, 10, 20 µg mL−1). J) Length distribution histogram of ZFO chain (10 µg mL−1) under the magnetic field of different magnetic field intensities (y axis: 1, 2, 3 mT) for 10 min. Scale bar: 20 µm. |
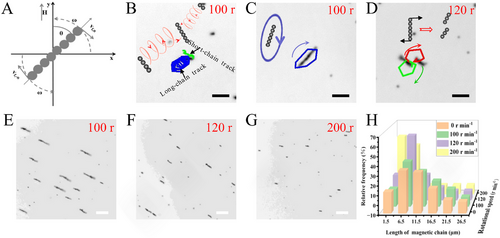
Magnetic actuation of ZFO micromotors. A) The schematic diagram of the relationship between the chain and the external magnetic field. B) Self-assembly of ZFO (10 µg mL−1) under the rotational magnetic field (2 mT) with a rotational speed of 100 r min−1. C) Trajectory of the rotational motion of ZFO micromotors (10 µg mL−1) in the rotational magnetic field (2 mT) with the rotation speed of 100 r min−1. D) The trajectory of the chain-breaking process of ZFO micromotors (10 µg mL−1) under the rotational magnetic field (2 mT) with the speed of 120 r min−1. E–G) The images of ZFO micromotors in 5% glucose solution at the concentration of 10 µg mL−1 under the rotational magnetic field (2 mT) for 10 min with the rotation speed of 100, 120, and 200 r min−1. H) Length distribution histogram of ZFO chain (10 µg mL−1) under the rotational magnetic field (2 mT) for 10 min at different rotational speeds (y axis: 100, 120, and 200 r min−1). Scale bar: 20 µm. |
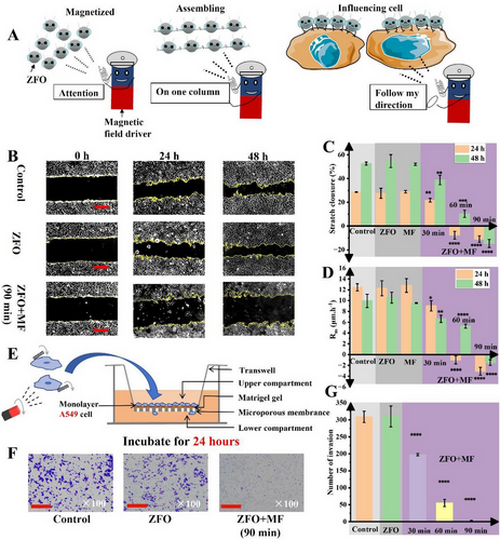
Rotation of ZFO micromotors inhibited the migration and invasion of A549 in vitro. A) The schematic diagram of the rotating ZFO micromotors based platform in the cell microenvironment. B) The images of scratches at different times (0, 24 h, 48 h after treatment) after different treatments (without ZFO, with ZFO but without rotational magnetic field, and after the action of magnetic ZFO micromotors for 90 min). C) Scratch closure at different times (24 h, 48 h after treatment) after different treatments (without ZFO, with motionless ZFO, with magnetic field only, after action of ZFO micromotors for 30, 60, 90 min) by scratch assay. D) Migration rate (Rm) at a different time (24 h, 48 h after treatment) after different treatments (without ZFO, with motionless ZFO, with magnetic field only, after the action of ZFO micromotors for 30, 60, 90 min). E) The schematic diagram of the transwell assay. F) Images of stained invading cells under different treatments (without ZFO, with ZFO but without rotational magnetic field and after action of ZFO micromotors for 90 min) after 24 h invasion, by transwell assay. 100 × magnification. G) Invading cell number upon different treatment (without ZFO, with motionless ZFO, and after the action of ZFO micromotors for 30, 60, 90 min) after 24 h invasion. Scale bar: 500 µm (B), 100 µm (F). Data are means ± SD of three independent experiments and *p < 0.05, **p < 0.01,***p < 0.001, ****p < 0.0001 versus control. |

Cell viability test, mRNA transcriptions, and protein changes in response to the mechanical change. A) Cell viability with motionless ZFO, with magnetic field only, and after different action times of ZFO micromotors (30, 60, 90 min) compared to the control group by CCK-8 assay. B) The fluorescent images of Calcein-AM/PI stained A549 cells after different treatments (without ZFO, with ZFO but without rotational magnetic field, and after the action of magnetic ZFO micromotors for 90 min). Scale bar, 100 µm. C) The LDH leakage amount after different treatments (without ZFO, with ZFO but without rotational magnetic field, and after the action of magnetic ZFO micromotors for 90 min). D) The mRNA quantification of the Piezo1 gene after different treatments (without ZFO, with motionless ZFO, with magnetic field only, after the action of ZFO micromotors for 30, 60, and 90 min). E) The mRNA quantification of the ROCK1 gene after different treatments (without ZFO, with ZFO but without rotational magnetic field, after the action of ZFO micromotors for 30, 60, and 90 min). F, G) Protein levels of Piezo1 and ROCK1 upon different treatments (without ZFO, with ZFO but without rotational magnetic field, after action of ZFO micromotors for 30, 60, 90 min) by Western Blot Analysis, with GAPDH (glyceraldehyde-3-phosphate dehydrogenase) as control. H–J) The localization of F-actin in A549 cells. The bright field images (H) and fluorescent images of F-actin in green and Hoechst for nucleus in blue (I) of A549 after different treatments (without ZFO, with ZFO but without rotational magnetic field, and after the action of magnetic ZFO micromotors for 90 min). (J) The enlarged views of F-actin staining. Scale bar: 50 µm (H-I), 6.5 µm (J). K) Statistical changes in cell area of A549. The number of cell statistics for each group is 100. Data are means ± SD of three independent experiments and *p < 0.05, **p < 0.01, ***p < 0.001, ****p < 0.0001 versus control. |
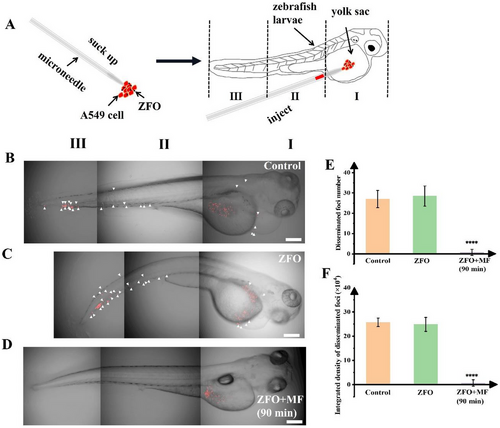
In vivo metastasis inhibition of the rotational ZFO micromotors to A549 cells in a zebrafish xenograft model. A) The schematic diagram of the zebrafish xenograft model. B–D) Representative images of zebrafish embryos, 3 days after microinjection of Dil stained A549 upon different treatments, without ZFO, with ZFO but without rotational magnetic field, and after the action of magnetic ZFO micromotors for 90 min. (n = 5 for each experimental group) Scale bar: 200 µm. E,F)The disseminated foci number and integrated fluorescence density of disseminated foci (fluorescence density outside the yolk sac) were quantified from the 3D fluorescent images of zebrafish, the disseminated foci were marked with white triangles. All values are expressed as the mean ± SD in at least three independent experiments. ****p < 0.0001 versus control. |