
- Title
-
Bi-allelic KICS2 mutations impair KICSTOR complex-mediated mTORC1 regulation, causing intellectual disability and epilepsy
- Authors
- Buchert, R., Burkhalter, M.D., Huridou, C., Sofan, L., Roser, T., Cremer, K., Alvi, J.R., Efthymiou, S., Froukh, T., Gulieva, S., Guliyeva, U., Hamdallah, M., Holder-Espinasse, M., Kaiyrzhanov, R., Klingler, D., Koko, M., Matthies, L., Park, J., Sturm, M., Velic, A., Spranger, S., Sultan, T., Engels, H., Lerche, H., Houlden, H., Pagnamenta, A.T., Borggraefe, I., Weber, Y., Bonnen, P.E., Maroofian, R., Riess, O., Weber, J.J., Philipp, M., Haack, T.B.
- Source
- Full text @ Am. J. Hum. Genet.
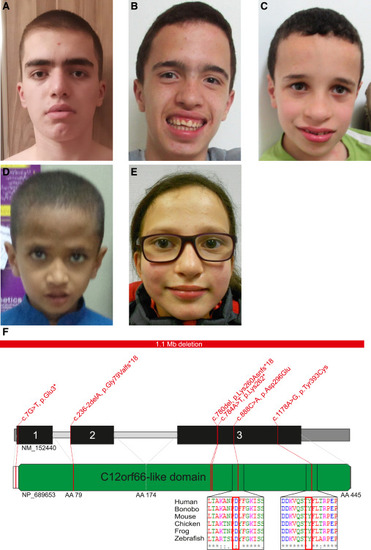
Pictures of individuals with KICS2 variants and the positions of the variants within the gene (A–E) Affected individuals show a short, deep philtrum, a short, broad nose, a broad nasal bridge, and a prominent forehead: (A) individual A:II-1 at age 15 years, (B) individual B:II-2 at age 16 years, (C) individual B:II-4 at age 10 years, (D) individual D:II-3 at age 7 years, and (E) individual H:II-1 at age 12 years. (F) KICS2 gene structure with the identified variants; identified missense variants are localized in highly conserved regions. |

Missense variants do not alter KICS2 levels or influence KICSTOR components, but the p.Lys260Asnfs∗18 variant is ubiquitinated and rapidly degraded by the UPS system (A) Western blot analysis of HEK293T cells overexpressing wild-type (WT) HA-tagged KICS2 or its variants, along with KICSTOR components FLAG-tagged SZT2 and MYC-tagged KPTN, shows a strong reduction in levels of the C-terminally truncated variant p.Lys260Asnfs∗18, while missense variants p.Tyr393Cys and p.Asp296Glu do not affect KICS2 amounts. High-intensity display reveals multiple high-molecular-weight, potentially post-translationally modified forms of KICS2 p.Lys260Asnfs∗18 (KICS2-fs [frameshift], marked with a dashed gray line). Overexpressed proteins were detected using tag-specific antibodies. GAPDH served as the loading control. LI, low intensity; HI, high intensity. (B) Relative quantification of HA-KICS2, FLAG-SZT2, and MYC-KPTN from n = 3 biological replicates (∗∗∗p < 0.001 and ∗p < 0.05, one-sample t test and two-way ANOVA followed by Tukey’s multiple comparison test). (C–E) Analysis of putatively ubiquitinated (Ub) forms of KICS2 using Ub-Trap immunoprecipitation (IP) of lysates obtained from HEK293T cells transfected with HA-tagged WT KICS2 or KICS2 p.Lys260Asnfs∗18 (KICS2-fs), or an empty control vector (mock), along with MYC-tagged KPTN and FLAG-tagged SZT2. Control beads (ctrl) were used for confirming specificity. Western blot of input samples and eluates, followed by SYPRO Ruby total protein staining, shows successful purification (C). Immunodetection with a Ub-specific antibody shows precipitation of polyubiquitinated (pUb) proteins (marked with a solid black line) (D), while HA-tag-specific immunodetection (E) demonstrates the presence of Ub forms of KICS2-WT and -fs (indicated by solid and dashed gray lines, respectively). GAPDH served as the loading control. The asterisk marks an unspecific protein band present in the input. Unmodified/non-Ub HA-KICS2-WT and -fs were detectable in both the IP:ctrl and IP:Ub lanes, likely due to non-specific or indirect binding of the protein, regardless of its modification status. (F) Investigation of the proteolytic mechanism responsible for the degradation of WT KICS2 and, in particular, the KICS2 p.Lys260Asnfs∗18 (KICS2-fs) variant. HEK293T cells expressing KICS2-WT and KICS2-fs, along with MYC-tagged KPTN and FLAG-tagged SZT2, were treated with the proteasome inhibitor epoxomicin (Epoxo) or autophagy inhibitor bafilomycin A1 (BafA1). DMSO served as the vehicle control. Western blot analysis confirms the accumulation of K48-linked pUb (K48-pUb) chains and LC3B-II as markers of successful proteasomal or autophagosomal inhibition, respectively. HA-tag-specific detection shows a strong accumulation of KICS2-WT and KICS2-fs, as well as their Ub forms (Ub-WT and Ub-fs), upon proteasomal, but not autophagosomal, inhibition. GAPDH served as the loading control. The asterisk marks an unspecific protein band. (G) Relative quantification of KICS2 and Ub KICS2 amounts, relative to vehicle-treated control from n = 3 biological replicates, shows significantly increased levels upon proteasomal inhibition. Calculating the ratios between Ub-KICS2 and KICS2 shows that baseline ubiquitination of KICS-fs is significantly higher compared to KICS2-WT (∗∗∗∗p < 0.0001, ∗∗p < 0.01, and ∗p < 0.05, one-sample t test and two-way ANOVA followed by Šídák’s multiple comparison test). |

Missense and frameshift variants of KICS2 compromise the formation of the KICSTOR complex (A and B) Interaction analysis of key components of the KICSTOR complex using FLAG-tag-specific co-immunoprecipitation (coIP) of lysates from HEK293T cells transfected with HA-tagged wild-type (WT) KICS2, its p.Tyr393Cys and p.Asp296Glu missense variants, or the truncated frameshift variant p.Lys260Asnfs∗18 (KICS2-fs), along with MYC-tagged KPTN and FLAG-tagged SZT2, or an empty control vector (mock). SZT2 was purified via its FLAG tag together with its binding partners KICS2 and KPTN. Western blot analysis of input samples and eluates, followed by SYPRO Ruby total protein staining, shows successful purification and precipitation of FLAG-SZT2 (A). Gray arrowheads mark Fab bands. KPTN and KICS2-WT were co-purified as interaction partners of SZT2, while all three KICS2 variants showed diminished binding (B). The previously reported SZT2 interaction partner LAMP2A was not co-precipitated. Overexpressed proteins were detected using tag-specific antibodies. GAPDH served as the loading control. (C) Relative quantification of co-precipitated MYC-KPTN and HA-KICS2, normalized to their expression levels, from n = 3 biological replicates. While KPTN binding was not influenced by the presence of the three KICS2 variants, all variants showed diminished binding to SZT2, with the KICS2-fs demonstrating the strongest reduction (∗∗∗p < 0.001, ∗∗p < 0.01, and ∗p < 0.05, one-sample t test and two-way ANOVA followed by Tukey’s multiple comparison test). (D and E) The interaction analysis was validated using FLAG-tag-specific coIP of lysates from HEK293T cells transfected with HA-tagged WT KICS2, its p.Tyr393Cys and p.Asp296Glu missense variants, the truncated fs variant p.Lys260Asnfs∗18 (KICS2-fs), or an empty control vector (mock), along with MYC-tagged KPTN and FLAG-tagged SZT2. HA-KICS2 was purified via its HA tag together with its binding partners SZT2 and KPTN. Western blot analysis of input samples and eluates, followed by SYPRO Ruby total protein staining, shows successful purification and co-precipitation of FLAG-SZT2 (D). SZT2 and KPTN were co-purified as interaction partners of WT KICS2, while interaction with all three KICS2 variants showed diminished binding or, in the case of SZT2 and the C-terminally truncated fs variant of KICS2, even an absence of interaction (E). Overexpressed proteins were detected using tag-specific antibodies. GAPDH served as the loading control. (F) Relative quantification of co-precipitated FLAG-SZT2 and MYC-KPTN, normalized to their expression levels, from n = 3 biological replicates. STZ2 binding to KICS2 variants was strongly reduced for the p.Tyr393Cys variant and practically absent for the C-terminally truncated fs variant. KPTN binding was also reduced, though it was not absent in the case of KICS2-fs (∗∗∗∗p < 0.0001, ∗∗∗p < 0.001, ∗∗p < 0.01, and ∗p < 0.05, one-sample t test and two-way ANOVA followed by Tukey’s multiple comparison test). |
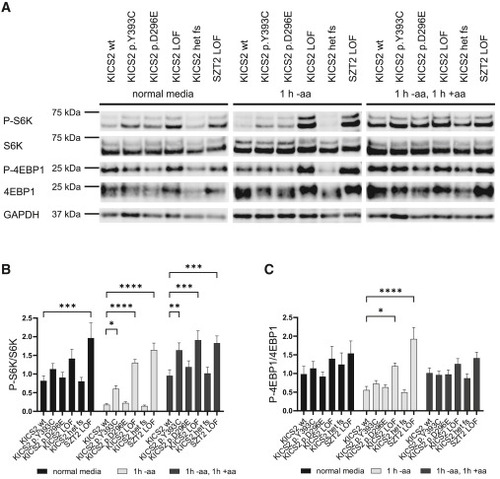
mTORC1 activity assay shows dysregulation of mTORC1 activity for the identified variants (A) HEK293T cells (wild type [WT], loss of function [LOF], heterozygous for LOF variant [het fs], or indicated variants) were incubated either for 1 h in amino-acid-free media (−aa) or for 1 h in amino-acid-free media followed by 1 h of normal growth media (+aa). Cells without prior incubation in amino-acid-free media were used as baseline control. Western blots were performed, and the amounts of P-S6K, S6K, P-4EBP1, and 4EBP1 were measured; GAPDH served as a loading control. For 4EBP1, two bands were detected, with the higher band corresponding most likely to the phosphorylated 4EBP1. For both LOF cell lines as well as the p.Tyr393Cys and, to some extent, the p.Asp296Glu cell line, a shift in these two bands can be seen for amino-acid-free media compared to the WT cell line. Quantification of this shift was hindered by the closeness of the bands. (B) Relative quantification of the changes in phosphorylation in S6K upon amino acid deprivation determined by the ratio of P-S6K and S6K in amino-acid-free media or normal growth media from n = 7 biological replicates (∗∗∗∗p < 0.0001, ∗∗∗p < 0.001, ∗∗p < 0.01, and ∗p < 0.05, two-way ANOVA followed by Dunnett’s multiple comparison test). (C) Relative quantification of the changes in phosphorylation in 4EBP1 upon amino acid deprivation determined by the ratio of P-4EBP1 and 4EBP1 in amino-acid-free media or normal growth media from n = 7 biological replicates (∗∗∗∗p < 0.0001, ∗∗∗p < 0.001, ∗∗p < 0.01, and ∗p < 0.05, two-way ANOVA followed by Dunnett’s multiple comparison test). |
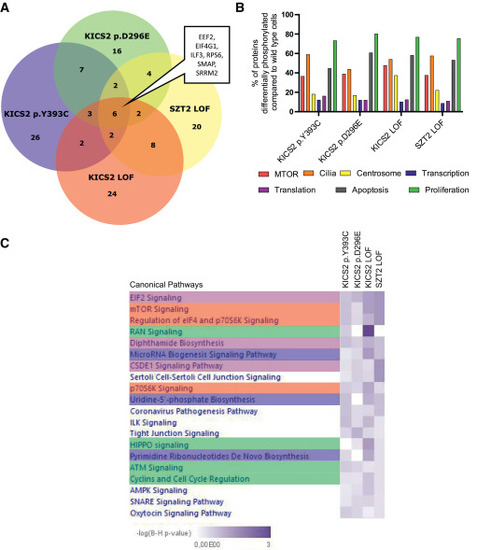
Phosphoproteome data reveal differentially phosphorylated proteins linked to cilia and the centrosome (A) Number of differentially phosphorylated proteins compared to wild-type cells per sample and overlap between samples. (B) Percentage of proteins associated with cellular processes (mTOR, cilia, centrosome, transcription, translation, apoptosis, and proliferation) that are differentially phosphorylated when compared to wild-type cells. (C) Pathway analysis using IPA indicates changes in several pathways associated with mTOR activity (red), transcription (blue), translation (violet), and proliferation (green). Only the top 20 signaling pathways are shown. |
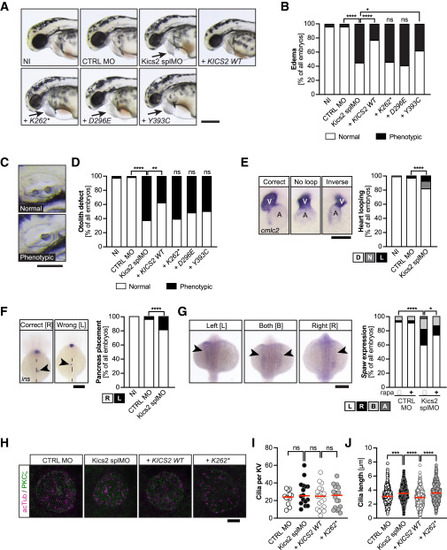
Kics2 loss-of-function impacts on embryonic development and cilium functionality (A) Kics2 depletion results in edema formation, which is not rescued by variants identified in this study. Live zebrafish at 48 hpf. Arrow indicates edema. NI, non-injected; CTRL MO, control MO; + KICS2 WT, + K262∗, + D296E, + Y393C, embryos co-injected with Kics2 splMO and capped RNA encoding human KICS2 WT or identified variants. Scale bar: 300 μm. (B) Stacked bar graph of edema formation summarizing 7 experiments with 77–121 embryos in total. Two-tailed Fisher’s exact test. ∗∗∗∗p < 0.0001, ∗p = 0.035, and ns: p > 0.05. (C) Loss of Kics2 function leads to defective otolith seeding at 48 hpf. Scale bar: 100 μm. (D) Stacked bar graph summarizing otolith defects in 7 experiments with 77–121 embryos in total. Two-tailed Fisher’s exact test. ∗∗∗∗p < 0.0001, ∗∗p = 0.0018, and ns: p > 0.05. (E) Kics2 depletion affects heart looping. Images of cmcl2 in situ hybridization at 48 hpf (scale bar: 100 μm; A, atrium; V, ventricle). Graph displays correct (D), unlooped (N), and inversely (L) looped hearts. Two-tailed Fisher’s exact test. ∗∗∗∗p < 0.0001. 8 experiments with 220–239 embryos. (F) Insulin (ins) in situ hybridization to detect pancreas localization. Dashed line: midline. Scale bar: 200 μm. Graph displays correctly (R) and wrongly (L) placed pancreata. Two-tailed Fisher’s exact test. ∗∗∗∗p < 0.0001. 8 experiments with 221–238 embryos. (G) Southpaw (spaw) expression is randomized upon kics2 knockdown but can be partially rescued by rapamycin treatment. Arrowheads: expression in the lateral plate mesoderm. Scale bar: 200 μm. Two-tailed Fisher’s exact test. ∗∗∗∗p < 0.0001 and ∗p = 0.0341. 5 experiments with 109–120 embryos. (H) Confocal stacks of 6 somite stage Kupffer’s vesicles (KVs) stained for acetylated tubulin (acTub; magenta) and PKCζ (green). Scale bar: 20 μm. (I) Kics2 manipulation does not affect the number of cilia per KV. 2 experiments with 12–19 embryos. Kruskal-Wallis test with Dunn’s multiple comparison test. ns: p > 0.05. (J) KV cilia become elongated upon loss of Kics2 function. 2 experiments with 135–323 cilia. Kruskal-Wallis test with Dunn’s multiple comparison test. ∗∗∗∗p < 0.0001 and ∗∗∗p = 0.001. EXPRESSION / LABELING:
PHENOTYPE:
|

ZFIN is incorporating published figure images and captions as part of an ongoing project. Figures from some publications have not yet been curated, or are not available for display because of copyright restrictions. |
|
ZFIN is incorporating published figure images and captions as part of an ongoing project. Figures from some publications have not yet been curated, or are not available for display because of copyright restrictions. PHENOTYPE:
|
|
ZFIN is incorporating published figure images and captions as part of an ongoing project. Figures from some publications have not yet been curated, or are not available for display because of copyright restrictions. |
|
ZFIN is incorporating published figure images and captions as part of an ongoing project. Figures from some publications have not yet been curated, or are not available for display because of copyright restrictions. |