
- Title
-
TRPM4 contributes to cell death in prostate cancer tumor spheroids, and to extravasation and metastasis in a zebrafish xenograft model system
- Authors
- Bochen, F., Subedi, S., La Manna, F., Jarrin, S., Papapostolou, I., Kruithof-de Julio, M., Peinelt, C.
- Source
- Full text @ Mol. Oncol.
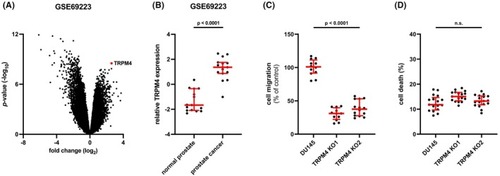
Expression of transient receptor potential melastatin‐4 ( |
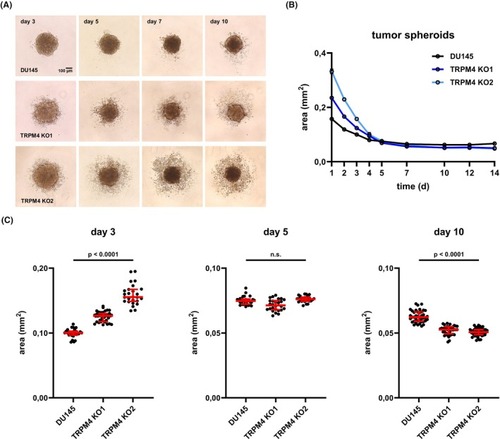
Transient receptor potential melastatin‐4 ( |
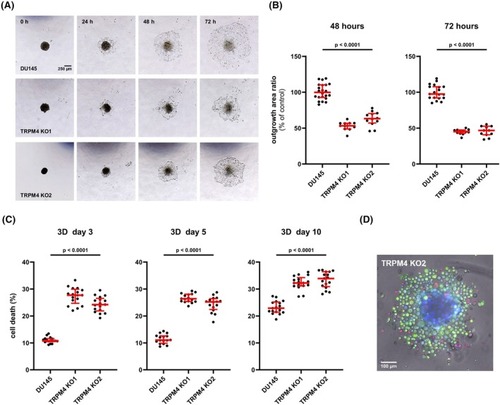
Transient receptor potential melastatin‐4 ( |
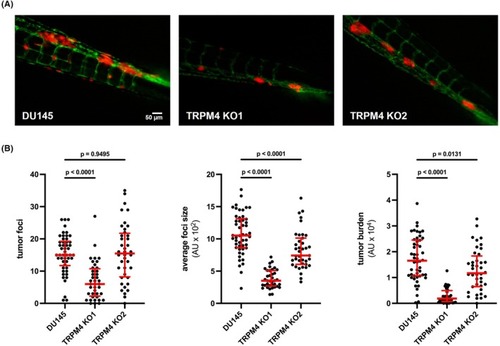
Transient receptor potential melastatin‐4 ( |