IMAGE

Fig. 1

ID
ZDB-IMAGE-250515-35
Source
Figures for Bochen et al., 2025
Image
Figure Caption

Fig. 1

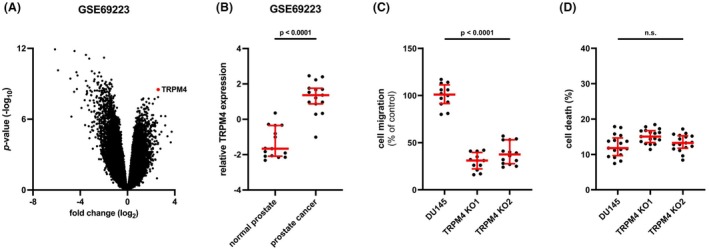
Expression of transient receptor potential melastatin‐4 (TRPM4) in prostate cancer (PCa) patient samples and migration and cell death in 2D cell assays. (A) Volcano plot of gene expression in matched malignant and nonmalignant prostate tissue samples from 15 PCa patients (GSE69223, mRNA microarray). (B) Relative expression of TRPM4 from data in (A). Differences between samples were analyzed using a two‐tailed paired t‐test. (C) Statistical analysis of cell migration of DU145 cells and corresponding TRPM4 knockout (KO) clones in FluoroBlok Boyden chambers 72 h postseeding (n = 4). (D) Cell death was quantified as the relative intensity of CellTox Green staining in DU145 cells and corresponding TRPM4 KO clones on day 3 postseeding (n = 4). All individual values are plotted as dots in the graph. The median is shown as a red line, whiskers represent the interquartile range. Significance levels for data from both clones in C and D are given relative to DU145 cells. Differences between samples were analyzed using one‐way ANOVA followed by Dunnett's post‐hoc test.

Acknowledgments
This image is the copyrighted work of the attributed author or publisher, and ZFIN has permission only to display this image to its users. Additional permissions should be obtained from the applicable author or publisher of the image. Full text @ Mol. Oncol.