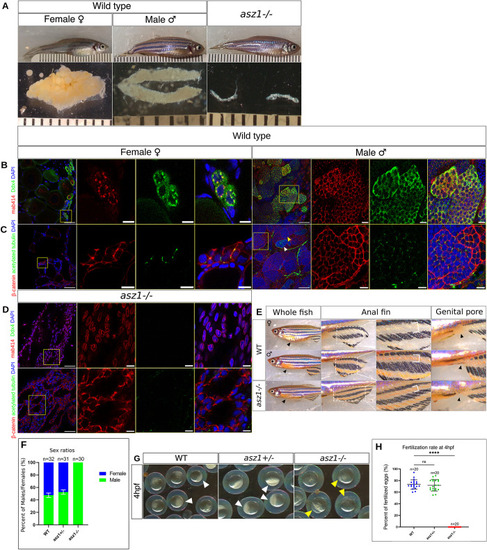
Loss of Asz1 results in germ cell loss and underdeveloped gonads and asz1-/- fish develop as sterile males.

A. Representative adult fish at 3 months post-fertilization and their corresponding gonads of the indicated genotypes. Ruler grades are 1mm, showing similar standard lengths (SL) of fish from all genotypes (S3A Fig), but much smaller gonads of asz1-/- compared to wt ovaries and testes. B-C. Representative confocal images of wt ovaries and testes, labeled with Ddx4 (green), mAb414 (red) and DAPI (blue) in B, and with Acetylated tubulin (green), β-Catenin (red) and DAPI (blue) in C. Insets show single and merge channels of magnifications of the yellow boxes in zoomed out images. Scale bars are 50 μm and 10 μm in zoomed out and inset magnification images, respectively. In C, yellow arrowheads indicate zygotene cilia in spermatocytes, and white arrowheads indicate flagella of mature sperm. For each B and C labeling, n = 12 ovaries and 12 testes. D.asz1-/- gonads labeled for, top: Ddx4 (green), mAb414 (red) and DAPI (blue), bottom: Acetylated tubulin (green), β-Catenin (red) and DAPI (blue), as in B-C. n = 6 gonads. E. Dimorphic external sex criteria in wt, and their phenotypes in asz1-/- fish. Left panels show larger abdomen in females (arrowheads). Middle panels show the anal fin (right images are zoomed-in magnifications), with more pigmented stripes (white bracket) in the male. Right panels show the larger genital pore in the female (arrowheads). asz1-/- fish exhibit typical male anatomy of all criteria. The number of analyzed fish is indicated in the plot in F. F. A plot showing the representative sex ratios in each genotype from two independent clutches as determined by the external sex criteria in E. n = number of fish. Bars are mean ± SD. G. Progeny embryos of crosses between wt females and either wt, asz1+/-, or asz1-/- males as indicated, at 4 hpf. Fertilized embryos exhibit an opaque animal pole which results from cellularization during cleavage stages (white arrowheads), while unfertilized eggs exhibit a transparent acellularized animal pole (yellow arrowheads). H. Dot plots showing the fertilization rates per mating from the crosses in G. n = number of cross pairs. Bars are mean ± SD.

Asz1 is essential for germ cell and gonad development in juvenile post-embryonic stages.

A. Representative juvenile gonads from fish at 6 wpf of the indicated genotypes. Ruler grades are 1mm, showing much smaller, thread-like, gonads of asz1-/- compared to wt ovaries and testes. The distribution of gonad morphology from two representative clutches is plotted in B. n = number of gonads. Bars are mean ± SD. C. Representative confocal images of ovaries and testes of the indicated genotypes as in A, labeled with Ddx4 (green), mAb414 (red) and DAPI (blue). Insets show single and merge channels of magnifications of the yellow boxes in zoomed out images. Scale bars are 50 μm and 10 μm in zoomed out and inset magnification images, respectively. Wt ovaries (n = 16) and testes (n = 14) exhibited normal developing oocytes and early spermatocytes, as well as oogonia and spermatogonia as indicated by Ddx4, with normal perinuclear piRNA granules, as indicated by mAb414 signals (white arrowheads in wt ovary). D. Representative confocal images of ovaries and testes of the indicated genotypes as in A, labeled with cCaspase3 (green), mAb414 (red) and DAPI (blue). Insets show single and merge channels of magnifications of the yellow boxes in zoomed out images. Scale bars are 50 μm and 10 μm in zoomed out and inset magnification images, respectively. White arrowheads indicate cCaspas3-positive apoptotic cells. n = 10 ovaries and 10 testes (wt). E.asz1-/- gonads labeled as in C-D. Top: Ddx4 (green), mAb414 (red) and DAPI (blue). asz1-/- gonads (n = 13) had only few Ddx4-positive germ cells which exhibited abnormal mAb414 signal that appeared as coalesced granules (white arrowheads in asz1-/- gonads). Bottom: Acetylated tubulin (green), β-Catenin (red) and DAPI (blue), as in C-D. n = 6 gonads. F. The number of apoptotic cells per gonad is plotted and is non-statistically significant between genotypes. n = number gonads. Bars are mean ± SD.

Asz1 is essential for germ cell survival during early gonad development.

A. Wt and asz1-/- gonads at 4 wpf as shown on Figs 1 and 2. At 4 hpf, prior to sex determination, all gonads are still developing as ovaries as shown in wt and asz1+/-. asz1-/- exhibit much smaller thread like gonads (white arrows in F) already at 4hpf. Yellow arrows in F indicate surrounding bright fat tissue. B. Distribution of gonad phenotypes as shown in A. n = number of gonads. C-F. Confocal images of wt (C-D) and asz1-/- (E-F) gonads, labeled for mAb414 and Ddx4, as well as β-Catenin and cCaspase3, as shown as in Figs 1 and 2. Developing ovaries in wt contain oogonia and early differentiating oocytes (Ddx4, green) with normally organized perinuclear granules (mAb414, red), but much fewer germ cells in asz1-/- that also exhibit coalesced mAb414 signals (white arrowheads in I). n = 6 gonads per genotype. cCaspase3 labeling (green) of wt, asz1+/-, and asz1-/- gonads. Cells with coalesced mAb414 signals in asz1-/- gonads (F), which are likely abnormal germ cells, are positive for cCaspase3 (white arrowheads in F). n = 5 gonads per genotype. Scale bars in are 50 μm and 10 μm in zoomed out and inset magnification images, respectively. G-H. asz1+/+;Tg(ddx4:GFP) and asz1-/-;Tg(ddx4:GFP) gonads labeled for GFP (magenta), cCspas3 (cyan), and DAPI (blue), showing germ cell apoptosis. Scale bars are 15 μm. I. The number of Ddx4-positive germ cells per gonad is plotted for each genotype. n = number of gonads. Bars are mean ± SD. J. The number of cCaspase3-positive cells are per gonad is plotted for each genotype. n = number of gonads. Bars are mean ± SD. K. % of Ddx4+ germ cells that are cCaspas3+ is plotted. n = number of gonads. Bars are mean ± SD.

Zygotic Asz1 is not required for PGC specification and migration.

A.asz1+/+;Tg(ddx4:GFP) and asz1-/-;Tg(ddx4:GFP) gonads at 3 wpf, labeld for Ddx4 (magenta) and DAPI (blue), showing similar number of Ddx4+ germ cells. Scale bars are 15 μm. B. The number of Ddx4+ germ cells from A, is plotted. n = number of gonads. Bars are mean ± SD. C. Ddx4 labeling in 24 hpf wt, asz1+/-, and asz1-/- embryos shows normal localization of PGCs to the presumptive gonad region (arrowheads). D. The number of PGCs per embryo as shown in C is plotted for each genotype and shows non-significant variation across genotypes. n = number of embryos. Bars are mean ± SD. E. Ddx4 labeling (green) in 5 dpf wt, asz1+/-, and asz1-/- larvae. Zoom in images on the presumptive gonad regions are shown. F. The number of PGCs per larvea as shown in E is plotted for each genotype and shows non-significant variation across genotypes. n = number of embryos. Bars are mean ± SD. G. Ddx4 labeling in 7 dpf wt, asz1+/-, and asz1-/- larvae shows normal localization of PGCs to the forming gonad region. Bottom images are zoom-in magnifications of the boxes in larvae in the top panels. H. The number of PGCs per larva as shown in G is plotted for each genotype, and shows non-significant variation across genotypes. n = number of embryos. Bars are mean ± SD.

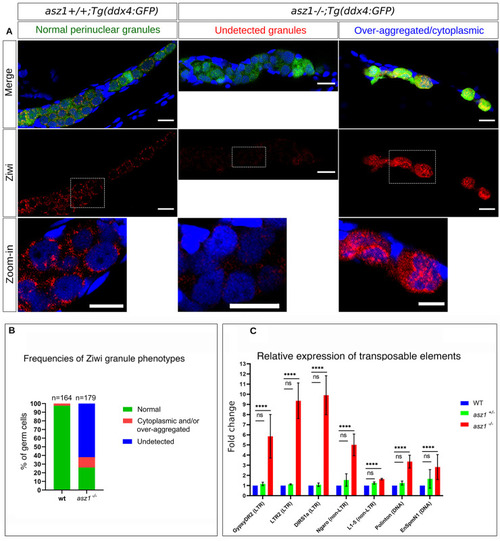
Asz1 is essential for piRNA granule organization ad repression of transposon expression.
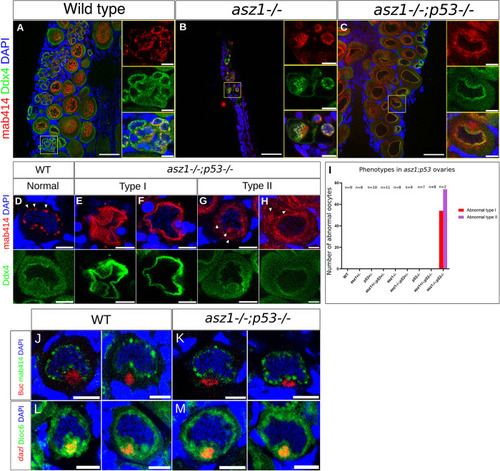
A. 3 wpf asz1+/+;Tg(ddx4:GFP) and asz1-/-;Tg(ddx4:GFP) gonads are labeled for Ddx4 (green), Ziwi (red), ad DAPI (blue). Images are: top - merge images, middle - Ziwi channel, bottom - zoom-in images of white dashed boxes. Normal Ziwi localization to perinuclear granules is shown in asz1+/+;Tg(ddx4:GFP) gonads. asz1-/-;Tg(ddx4:GFP) gonads exhibit mostly undetected Ziwi granules (left), or over-aggregated and/or cytoplasmic Ziwi localization (right). Scale bars are 15 μm. B. Frequencies of Ziwi phenotypes from A are plotted. n = number of germ cells. Bars are mean ± SD. C. RT-qPCR analysis of the expression of germline transposons in 5 wpf gonads from each genotype (n = 50 gonads per genotype), as normalized for RNA loading by β-act as well as for germ cells by vasa expression (see methods). Bars are mean ± SD from biological duplicates, each made with technical replicates. Statistical analyses were tested by ANOVA.

Partially rescued asz1 ovaries reveal defective oogenesis, but normal Bb.

A-C. Ovaries of the indicated genotypes were labeled with Ddx4 (green), mAb414 (red), and DAPI (blue). Images show representative general morphology of gonads. Right panels are single and merged channels zoomed-in images of the yellow boxed regions in the left panels. Scale bars are 50 μm and 10 μm in zoomed out and inset magnification images, respectively. Ovaries of all genotypes exhibit normally developing oocytes and ovarian morphology, except the following. asz1-/- and asz1-/-; tp53+/- gonads exhibited the defective testes morphology as shown in previous figures. asz1-/-;tp53-/- ovaries showed defective oocytes, with abnormal nuclear morphology mAb414 granule signals, as detailed in D-H below. n = 7-11 gonads per genotype, and 2 ovaries in asz1-/-;tp53-/-, see I below. Full panel of all genotypes is shown in S5 Fig. D-H. Images of normal oocytes in the wt (D), and representative defective oocytes in asz1-/-;tp53-/- ovaries (E-H) from A, showing mAb414 and DAPI in the top panels and Ddx4 in the bottom panels per oocyte. Two representative images of defective type I oocytes that exhibit abnormal, seemingly collapsed, morphology are shown in E-F. Two representative images of defective type II oocytes with ectopic mAb414 signals that appear as coalesced mis-organized cytoplasmic aggregates are shown in G-H (arrowheads), as opposed to perinuclear granules in wt (arrowheads in D). The distribution of these phenotypes in gonads is plotted in I. Scale bars are 10 μm. I. The number of defective type I (red) and type II (purple) per gonad is plotted for each genotype. Both phenotypes were only detected in asz1-/-;tp53-/- ovaries. n = number of gonads. J-K. The Buc protein (red) shows normal localization in the forming Bb in the nuclear cleft (mAb14, green; DAPI, blue). n = 5 wt ovaries and 2 asz1-/-;tp53-/- ovaries. Representative images of all gonads are shown in S6 Fig. L-M. The dazl mRNA (HCR-FISH, red) shows normal localization in the forming Bb in the nuclear cleft (cytoplasm labeled with DiOC6, green; DAPI, blue). n = 3 wt ovaries and 2 asz1-/-;tp53-/- ovaries. Representative images of all gonads are shown in S7 Fig. Scale bars in A-D are 10 μm.

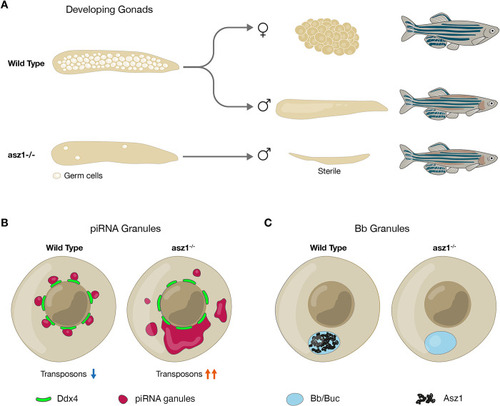
Schematics of the germline developmental requirement for Asz1 functions.

A. Wt juvenile gonads contain developing germ cells and give rise to ovaries and testes and fertile adult fish. Upon loss of Asz1, germ cells in juvenile gonads are lost by apoptosis, resulting in underdeveloped testes-like gonads that completely lack germ cells in the adult, and leading to development of fish as sterile males. B. Asz1 is essential for suppression of transposon expression very likely by acting in the piRNA pathway as shown in Drosophila and mice (blue and orange arrows). Loss of Asz1 also results in mis-organization of piRNA granules as detected by Ziwi and a yet unknown FG-repeat protein (maroon) of these granules. C. In contrast with piRNA granules, Asz1 (black) localizes to the Bb (light blue), but upon its loss, Bb granules are normally intact. These observations reveal differential necessities for Asz1 in distinct types of germline granules in zebrafish.

Acknowledgments
This image is the copyrighted work of the attributed author or publisher, and ZFIN has permission only to display this image to its users. Additional permissions should be obtained from the applicable author or publisher of the image. Full text @ PLoS Genet.