|
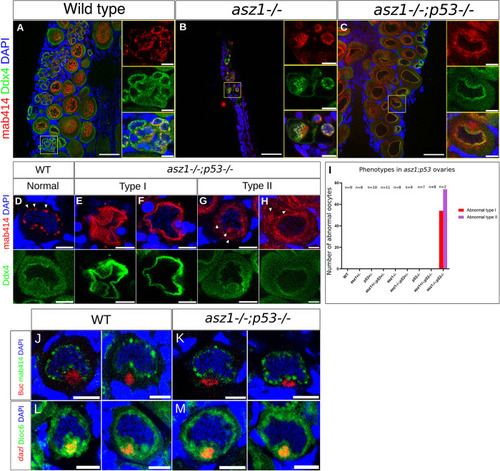
Partially rescued asz1 ovaries reveal defective oogenesis, but normal Bb. A-C. Ovaries of the indicated genotypes were labeled with Ddx4 (green), mAb414 (red), and DAPI (blue). Images show representative general morphology of gonads. Right panels are single and merged channels zoomed-in images of the yellow boxed regions in the left panels. Scale bars are 50 μm and 10 μm in zoomed out and inset magnification images, respectively. Ovaries of all genotypes exhibit normally developing oocytes and ovarian morphology, except the following. asz1-/- and asz1-/-; tp53+/- gonads exhibited the defective testes morphology as shown in previous figures. asz1-/-;tp53-/- ovaries showed defective oocytes, with abnormal nuclear morphology mAb414 granule signals, as detailed in D-H below. n = 7-11 gonads per genotype, and 2 ovaries in asz1-/-;tp53-/-, see I below. Full panel of all genotypes is shown in S5 Fig. D-H. Images of normal oocytes in the wt (D), and representative defective oocytes in asz1-/-;tp53-/- ovaries (E-H) from A, showing mAb414 and DAPI in the top panels and Ddx4 in the bottom panels per oocyte. Two representative images of defective type I oocytes that exhibit abnormal, seemingly collapsed, morphology are shown in E-F. Two representative images of defective type II oocytes with ectopic mAb414 signals that appear as coalesced mis-organized cytoplasmic aggregates are shown in G-H (arrowheads), as opposed to perinuclear granules in wt (arrowheads in D). The distribution of these phenotypes in gonads is plotted in I. Scale bars are 10 μm. I. The number of defective type I (red) and type II (purple) per gonad is plotted for each genotype. Both phenotypes were only detected in asz1-/-;tp53-/- ovaries. n = number of gonads. J-K. The Buc protein (red) shows normal localization in the forming Bb in the nuclear cleft (mAb14, green; DAPI, blue). n = 5 wt ovaries and 2 asz1-/-;tp53-/- ovaries. Representative images of all gonads are shown in S6 Fig. L-M. The dazl mRNA (HCR-FISH, red) shows normal localization in the forming Bb in the nuclear cleft (cytoplasm labeled with DiOC6, green; DAPI, blue). n = 3 wt ovaries and 2 asz1-/-;tp53-/- ovaries. Representative images of all gonads are shown in S7 Fig. Scale bars in A-D are 10 μm.
|