IMAGE

Fig 4

ID
ZDB-IMAGE-250127-116
Source
Figures for Ahmad et al., 2025
Image
Figure Caption

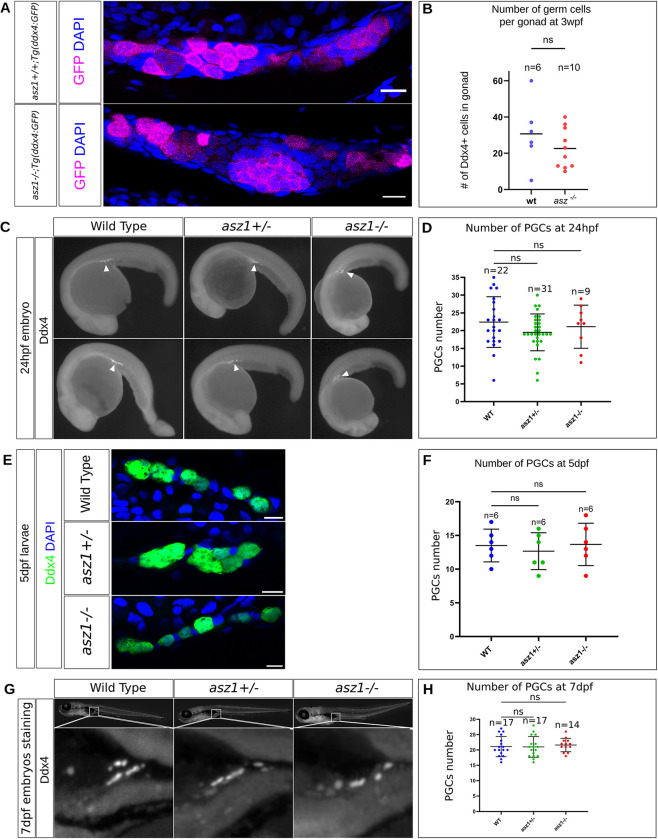
Fig 4 Zygotic Asz1 is not required for PGC specification and migration.

A.asz1+/+;Tg(ddx4:GFP) and asz1-/-;Tg(ddx4:GFP) gonads at 3 wpf, labeld for Ddx4 (magenta) and DAPI (blue), showing similar number of Ddx4+ germ cells. Scale bars are 15 μm. B. The number of Ddx4+ germ cells from A, is plotted. n = number of gonads. Bars are mean ± SD. C. Ddx4 labeling in 24 hpf wt, asz1+/-, and asz1-/- embryos shows normal localization of PGCs to the presumptive gonad region (arrowheads). D. The number of PGCs per embryo as shown in C is plotted for each genotype and shows non-significant variation across genotypes. n = number of embryos. Bars are mean ± SD. E. Ddx4 labeling (green) in 5 dpf wt, asz1+/-, and asz1-/- larvae. Zoom in images on the presumptive gonad regions are shown. F. The number of PGCs per larvea as shown in E is plotted for each genotype and shows non-significant variation across genotypes. n = number of embryos. Bars are mean ± SD. G. Ddx4 labeling in 7 dpf wt, asz1+/-, and asz1-/- larvae shows normal localization of PGCs to the forming gonad region. Bottom images are zoom-in magnifications of the boxes in larvae in the top panels. H. The number of PGCs per larva as shown in G is plotted for each genotype, and shows non-significant variation across genotypes. n = number of embryos. Bars are mean ± SD.

Acknowledgments
This image is the copyrighted work of the attributed author or publisher, and ZFIN has permission only to display this image to its users. Additional permissions should be obtained from the applicable author or publisher of the image. Full text @ PLoS Genet.