
- Title
-
Tokay gecko tail regeneration involves temporally collinear expression of HOXC genes and early expression of satellite cell markers
- Authors
- Nurhidayat, L., Benes, V., Blom, S., Gomes, I., Firdausi, N., de Bakker, M.A.G., Spaink, H.P., Richardson, M.K.
- Source
- Full text @ BMC Biol.
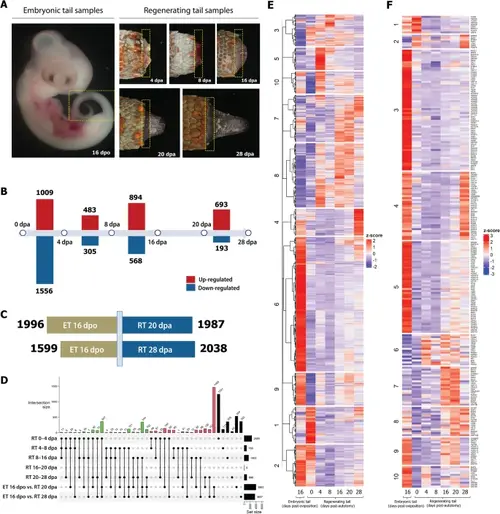
Transcriptome analysis shows a distinctive gene expression profile at each stage of regenerating tail and embryonic tail. A Gecko samples used for transcriptome analysis (indicated by boxed areas). Note that we also included adult tail stump/0 dpa for transcriptome analysis (figure not shown). B Number of up- and down-regulated genes during tail regeneration stages. Differential gene expression analysis by stage-wise comparison. Three biological replicates each stage. Significant differential expression (DE) genes with adjusted p-value < 0.01 and L2FC ≥ 1. Statistical test results can be found in Additional file 6: Suppl_ 1. C Number of genes regulated in regenerating tail vs. embryonic tail. ET embryonic tail, RT regenerating tail. Three biological replicates each stage. Significant differential expression (DE) genes with adjusted p-value < 0.01 and L2FC ≥ 1. D UpSet of cross-state showing the comparison between different stages of regeneration and tail development. ET embryonic tail, RT regenerating tail. E Heatmap of 6817 significant differentially expressed genes (whole transcriptome) in embryonic and regenerating tails of the Tokay Gecko. F Heatmap of 236 significant differentially expressed genes (toolkit genes only) in embryonic and regenerating tails of the tokay gecko |
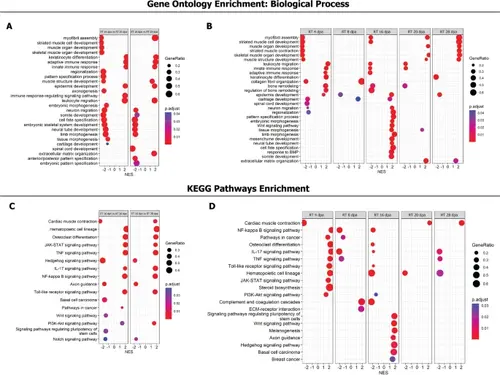
Gene set enrichment analysis reveals biological processes and pathways enriched across stages of tail regeneration and in the embryonic tail. A Biological process enrichment in regenerating tail vs. embryonic tail. B Biological processes enrichment at different stages of tail regeneration. C Pathway enrichment in regenerating tail vs. embryonic tail. D Pathway enrichment at different stages of tail regeneration. ET embryonic tail, RT regenerating tail. The more extensive results are shown in Additional file 7: Fig. S6, Additional file 8: Fig. S7, Additional file 9: Suppl_ 2 and Additional file 10: Suppl_ 3 |
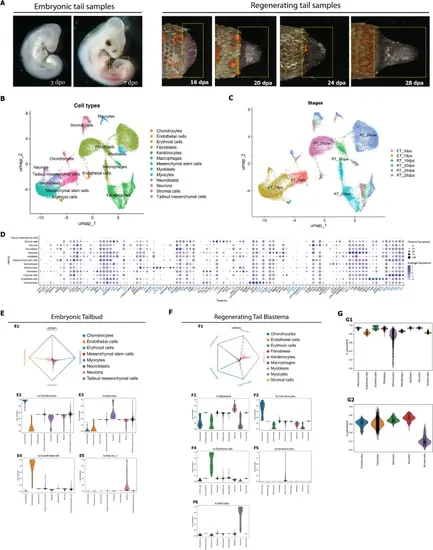
Different cell populations in the regeneration blastema and embryonic the tail bud. A Samples used for single-cell RNA sequencing (boxed area). Key: dpa, days post autotomy; dpo, days post oviposition. B UMAP plot showing cells in the regeneration blastema and embryonic the tail bud clustered by cell type. C UMAP plot of cells in the regeneration blastema and embryonic tail bud clustered by stages. D Genes making up the expression profiles of the different cell types in B. The gene symbols highlighted in blue represent human gene orthologs identified based on gene descriptions from the Sphaerodactylus townsendi gene identifier. The mapping of gene symbols and corresponding gene identifiers in Sphaerodactylus townsendi genome is provided in Additional file 11: Table S1. E Cell fate probability estimation of embryonic tail bud. E1, fate probabilities of embryonic tail bud cell clusters towards estimated terminal states; E2–E5 fate commitment of each cell cluster in regenerating tail blastema towards terminal states. F Cell fate probability estimation of regenerating tail blastema. F1, fate probabilities of regenerating tail blastema cell clusters towards estimated terminal states; F2–F6, fate commitment of each cell cluster in regenerating tail blastema towards terminal states. G Pseudotime analysis of regenerating tail blastema. G1, distribution of pseudotime values of all cell clusters of regenerating tail blastema; G2, distribution of pseudotime values of mesenchymal lineage cell clusters of regenerating tail blastema |
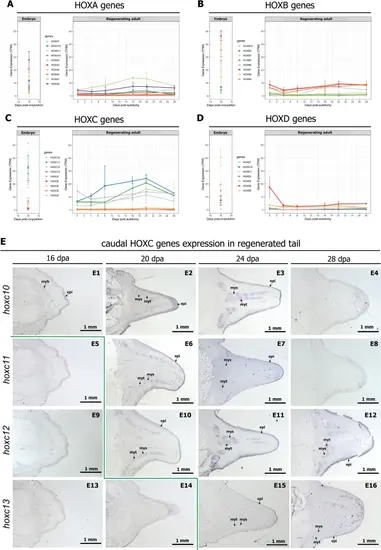
HOXC genes are activated during adult tail regeneration in a temporally collinear pattern. A–D Expression profiles of HOX genes in the embryonic tail and adult regenerating tail. E Caudal HOXC genes are sequentially expressed during tail regeneration. In situ hybridization on tissue sections. For high magnification views of these figures, see Additional file 3: Fig. S3. Key: myb, myoblast; myt, myotube; mys, myoseptum; epi, epidermis |
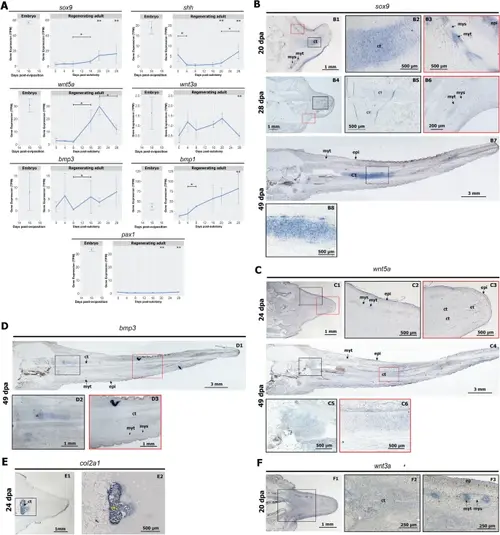
Chondrogenesis in the regenerating tail is uncoupled from segmentation. A Expression profiles of chondrogenesis genes in the embryonic tail (left) and during adult tail regeneration (right). One asterisk (*) shows significant differential expression in stage-wise comparison. Two asterisk (**) shows significant differential expression compared to embryonic tail 16 dpo. Significant differential expression (DE) genes with adjusted p-value < 0.01 and L2FC ≥ 1. B Expression of sox9 in the regenerating tail. epi epidermis, ct cartilage tube, my myotube, mys myoseptum. C Expression of wnt5a in the regenerating tail. D Expression of bmp3 at later stages of tail regeneration. E Expression of col2a1 in the 24 dpa regenerating tail. F Expression of wnt3a at 20 dpa regenerating tail |
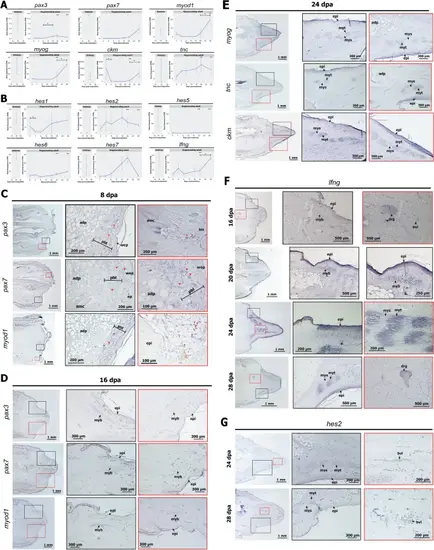
Tail regeneration in the gecko involves a unique pattern of skeletal muscle development. A Expression profiles of myogenesis genes in the embryonic tail (left) and during adult tail regeneration (right). One asterisk (*) shows significant differential expression in stage-wise comparison. Two asterisk (**) shows significant differential expression compared to embryonic tail 16 dpo. Significant differential expression (DE) genes with adjusted p-value < 0.01 and L2FC ≥ 1. B Expression profiles of somite segmentation genes in the embryonic tail (left) and during adult tail regeneration (right). C Expression of pax3, pax7, and myod1 at 8 dpa in the regenerating tail. Key: adp adipose tissue, amc adult muscle cells, pbl pre-blastema, wep wound epithelium, epi epidermis. D Expression of pax3, pax7, and myod1 at 16 dpa of the regenerating tail. Key: myb myoblast. E Expression of myog, tnc, and ckm at 24 dpa in the regenerating tail. Key: myt myotube, mys myoseptum. F Expression of lfng in the regenerating tail. Key: drg dorsal root ganglion. G The expression of hes2 in the regenerating tail. Key: bvl blood vessel |
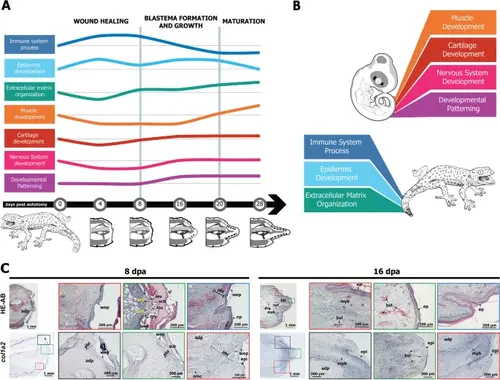
A summary of selected key features of tail regeneration in the tokay gecko. A Schematic overview of biological process enrichment in the transcriptome at selected stages of tail regeneration. The height of each line represents (schematically) the relative enrichment or the process. The greyscale drawings at the bottom represent the histological structure of the regenerating tail at that stage. B Schematic illustration highlighting the major differences in the dominant pathways in the regenerating tail vs. the embryonic tail. C There is no apical growth zone in the regenerating tail of the tokay gecko. The tissues immediately under the wound epithelium (pre-blastema) are dominated by col1a2+ connective tissue cells. Key: adp adipose tissue, amc adult muscle cells, bls blastema, bvl blood vessel, ep epidermis, ery erythrocytes, leu leukocytes, myb myoblast, pbl pre-blastema, scb wound scab, wep wound epithelium |