
|
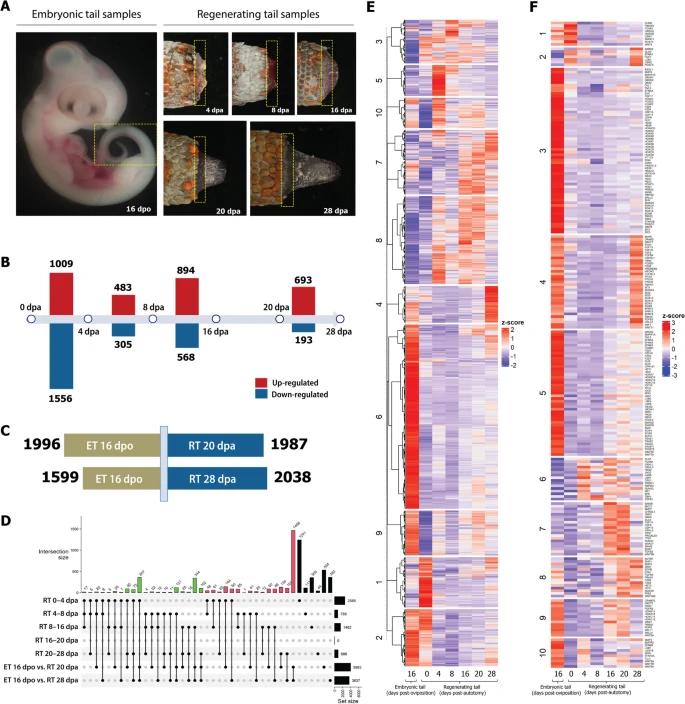
Fig. 1 Transcriptome analysis shows a distinctive gene expression profile at each stage of regenerating tail and embryonic tail. A Gecko samples used for transcriptome analysis (indicated by boxed areas). Note that we also included adult tail stump/0 dpa for transcriptome analysis (figure not shown). B Number of up- and down-regulated genes during tail regeneration stages. Differential gene expression analysis by stage-wise comparison. Three biological replicates each stage. Significant differential expression (DE) genes with adjusted p-value < 0.01 and L2FC ≥ 1. Statistical test results can be found in Additional file 6: Suppl_ 1. C Number of genes regulated in regenerating tail vs. embryonic tail. ET embryonic tail, RT regenerating tail. Three biological replicates each stage. Significant differential expression (DE) genes with adjusted p-value < 0.01 and L2FC ≥ 1. D UpSet of cross-state showing the comparison between different stages of regeneration and tail development. ET embryonic tail, RT regenerating tail. E Heatmap of 6817 significant differentially expressed genes (whole transcriptome) in embryonic and regenerating tails of the Tokay Gecko. F Heatmap of 236 significant differentially expressed genes (toolkit genes only) in embryonic and regenerating tails of the tokay gecko