
|
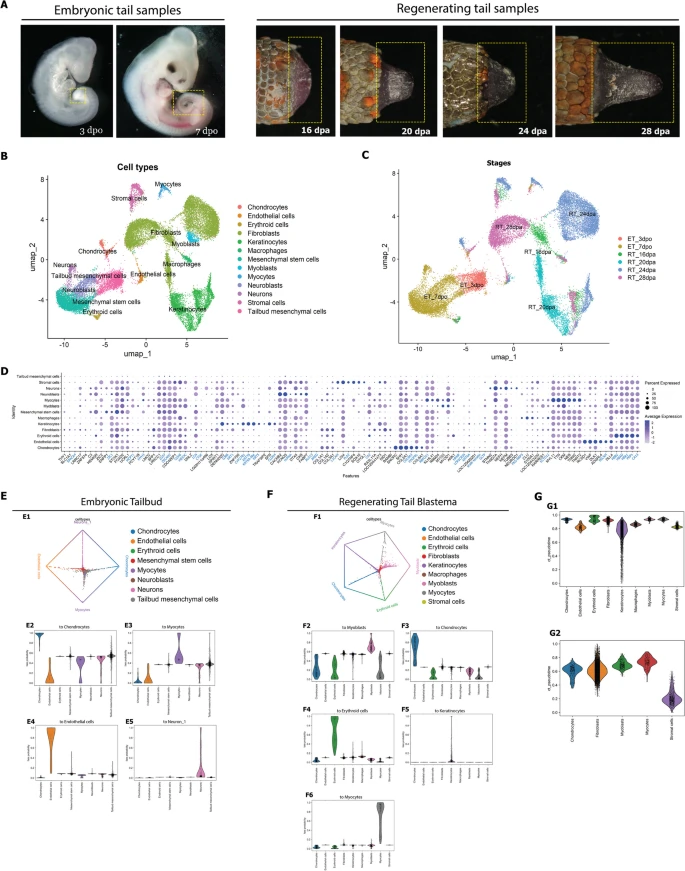
Fig. 3 Different cell populations in the regeneration blastema and embryonic the tail bud. A Samples used for single-cell RNA sequencing (boxed area). Key: dpa, days post autotomy; dpo, days post oviposition. B UMAP plot showing cells in the regeneration blastema and embryonic the tail bud clustered by cell type. C UMAP plot of cells in the regeneration blastema and embryonic tail bud clustered by stages. D Genes making up the expression profiles of the different cell types in B. The gene symbols highlighted in blue represent human gene orthologs identified based on gene descriptions from the Sphaerodactylus townsendi gene identifier. The mapping of gene symbols and corresponding gene identifiers in Sphaerodactylus townsendi genome is provided in Additional file 11: Table S1. E Cell fate probability estimation of embryonic tail bud. E1, fate probabilities of embryonic tail bud cell clusters towards estimated terminal states; E2–E5 fate commitment of each cell cluster in regenerating tail blastema towards terminal states. F Cell fate probability estimation of regenerating tail blastema. F1, fate probabilities of regenerating tail blastema cell clusters towards estimated terminal states; F2–F6, fate commitment of each cell cluster in regenerating tail blastema towards terminal states. G Pseudotime analysis of regenerating tail blastema. G1, distribution of pseudotime values of all cell clusters of regenerating tail blastema; G2, distribution of pseudotime values of mesenchymal lineage cell clusters of regenerating tail blastema