
- Title
-
Foxo3-mediated physiological cell competition ensures robust tissue patterning throughout vertebrate development
- Authors
- Matsumoto, K., Akieda, Y., Haraoka, Y., Hirono, N., Sasaki, H., Ishitani, T.
- Source
- Full text @ Nat. Commun.
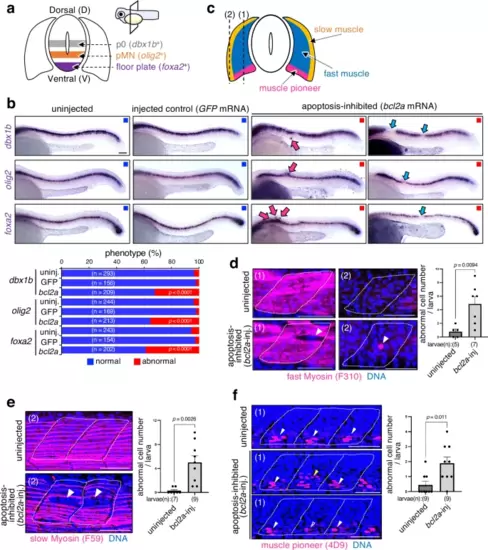
Apoptosis is essential for precise spinal cord and muscle patterning.a Schematic illustration of the expression patterns of dbx1b (a p0 neural progenitor marker), olig2 (a pMN neural progenitor marker), and foxa2 (a floor plate progenitor marker) in the spinal cord. b Inhibiting apoptosis distorts dorso-ventral (DV) patterning in the spinal cord. The panels show whole-mount in situ hybridisation of dbx1b, olig2, and foxa2 in wild-type (uninjected), injected control (GFP mRNA-injected) and apoptosis-inhibited (bcl2a mRNA-injected) 24 h post-fertilisation (hpf) larvae. In abnormal larvae, dbx1b, olig2, and foxa2 were ectopically activated or inactivated in discontinuous regions. The bottom graph shows the percentages of larvae with normal or abnormal expression patterns in uninjected, GFP mRNA- or bcl2a mRNA-injected (apoptosis-inhibited) larvae. Scale bar = 100 μm. The chi-square test was used for statistical analysis. c Schematic illustration of muscle cell pattern. The labels (1) and (2) in (d–f) correspond to the images of sections indicated as (1) and (2) in (c). d–f Apoptosis inhibition distorts gene expression patterns in the muscle primordia. The panels show whole-mount immunostaining for fast myosin (F310, fast muscle cells) (d), slow myosin (F59, slow muscle cells) (e), and muscle pioneer (4D9, muscle pioneer cells) (f), respectively (magenta). In abnormal larvae, fast myosin, slow myosin, and muscle pioneer proteins are ectopically expressed or are absent. Scale bar = 100 μm. Bar plots on the right show the mean + SEM of abnormal gene expressing-cell numbers in wild-type (uninjected) and apoptosis-inhibited (bcl2a mRNA-injected) larvae. An unpaired two-tailed t-test was used for the statistical analysis. Source data are provided as a Source Data file. |
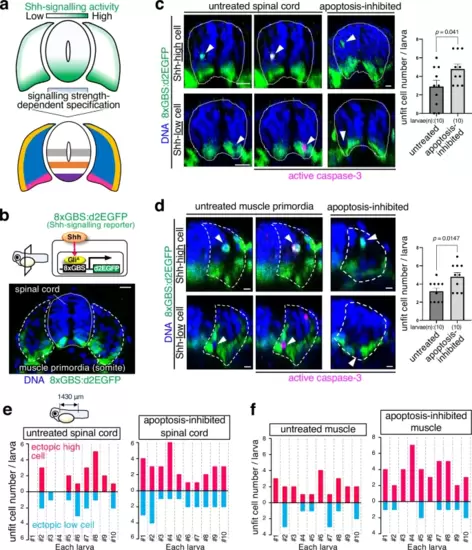
Shh-unfit cells are apoptotically eliminated.a The strength of Shh signalling activity mediates distinct cell types specification in the spinal cord and muscle. b In a horizontal plane, 8xGBS:d2EGFP drives destabilised enhanced green fluorescent protein (d2EGFP) expression in response to Shh signalling activation in the developing spinal cord and muscle of reporter larvae (cross-sectional view with the dorsal on top, 24 hpf). The dotted line and dashed line represent the spinal cord and muscle primordia boundaries, respectively. Scale bar = 10 μm. c, d Caspase-3 activation in cells with impaired Shh signalling activity during spinal cord (c) and muscle development (d). Whole-mount immunostaining of d2EGFP (green) horizonal plane and active caspase-3 (magenta) in Tg(8xGBS:d2EGFP) zebrafish larvae untreated or apoptosis-inhibited (bcl2a mRNA-injected). Arrowheads indicate cells with abnormal Shh signalling-reporter activity. Scale bar = 10 μm. The bar plots show the mean + SEM of unfit cell frequencies in untreated and apoptosis-inhibited larvae. An unpaired two-tailed t-test was used for the statistical analysis. e, f Inhibiting apoptosis enhances the Shh-unfit cell accumulation in the spinal cord (e) and muscle (f). The bar plots show unfit cell frequencies in untreated and apoptosis-inhibited larvae. Each larva has a different number of spontaneously appearing unfit cells with abnormally high or low Shh signalling activity. Source data are provided as a Source Data file. |
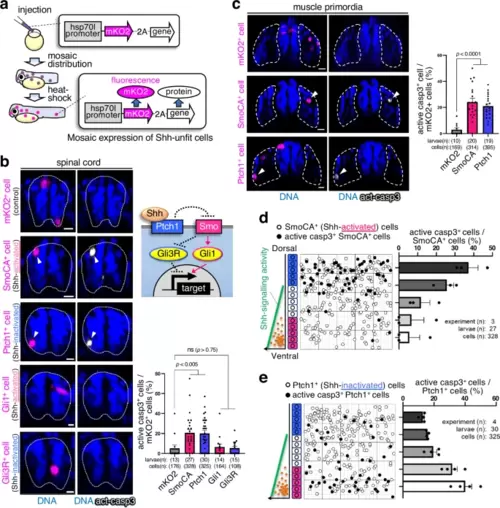
Substantial differences in Shh-activity trigger apoptosis. a Schematic diagram of the experimental introduction of abnormal fluorescent Shh signalling cells into zebrafish larvae in a mosaic manner through heat shock induction. b, c Artificially introduced SmoCA-expressing (Shh-activated) or Ptch1-overexpressing (Shh-inactivated) cells underwent apoptosis, but Gli1- or Gli3R-expressing cells did not undergo apoptosis in the spinal cord (b) and muscle (c). Confocal microscopy images show whole-mount immunostaining of active caspase-3 (grey) in mosaic larvae expressing mKO2 alone or with SmoCA, Ptch1, Gli1, or Gli3R (magenta). Arrowheads indicate caspase-3 active cells. Scale bar = 10 μm. Bar plots show the mean + SEM of the mKO2+ and caspase-3-active cell frequencies. Two-tailed one-way ANOVA was used for the statistical analysis. d, e Cells causing substantial noise in the Shh gradient efficiently underwent apoptosis. The left panels show maps of artificially introduced SmoCA- or Ptch1-expressing cells in the zebrafish spinal cord. The graphs on the right show the mean + SEM of mKO2+ and caspase-3-active cell frequencies within a divided range along the dorso-ventral (DV) axis. Source data are provided as a Source Data file. |
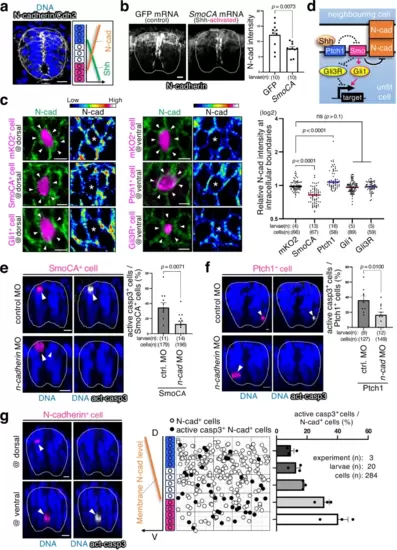
N-cadherin mediates the sensing of unfit cells. a N-cadherin/Cdh2 levels inversely correlate with Shh activity. Representative images show whole-mount immunostaining for N-cadherin (grey). Scale bar = 10 μm. b Activating Shh signalling reduces N-cadherin levels. Shh-activated larvae were prepared by injecting SmoCA mRNA. Scale bar = 10 μm. The mean + SEM of N-cadherin intensity of each larva is graphed. An unpaired two-tailed t-test was used for the statistical analysis. c Mosaic introduction of SmoCA- or Ptch1-expressing cells altered endogenous N-cadherin levels. Confocal images show whole-mount immunostaining for N-cadherin (green) and mosaic expression of mKO2 alone or with SmoCA, Ptch1, Gli1, or Gli3R (magenta). The fluorescence intensity of intercellular N-cadherin staining between mKO2+ cells and neighbouring wild-type cells was normalised to the intercellular fluorescence intensity between wild-type cells. Each dot represents an mKO2+ cell. Two-tailed one-way ANOVA was used. d Schematic illustration of the Shh signalling pathway and N-cadherin regulation. e, f Partial N-cadherin knockdown by injecting low-dose n-cadherin oligo morpholino (MO) blocks SmoCA- (e) or Ptch1- (f) -expressing cell elimination. Scale bar = 10 μm. The graphs on the right show the mean + SEM of mKO2+ (SmoCA, Ptch1) and caspase-3-active cell frequencies. An unpaired two-tailed t-test was used for the statistical analysis. g Cells causing excess noise in N-cadherin-gradients efficiently underwent apoptosis. Confocal images show whole-mount immunostaining of mosaically introduced N-cadherin-overexpressing cells (magenta) and active caspase-3 (grey). Scale bar = 10 μm. The middle panel shows maps of N-cadherin cells artificially introduced into the spinal cord. The right graph indicates the mean + SEM of mKO2+ and caspase-3-active cell frequencies within a divided range along the DV axis. Source data are provided as a Source Data file. |
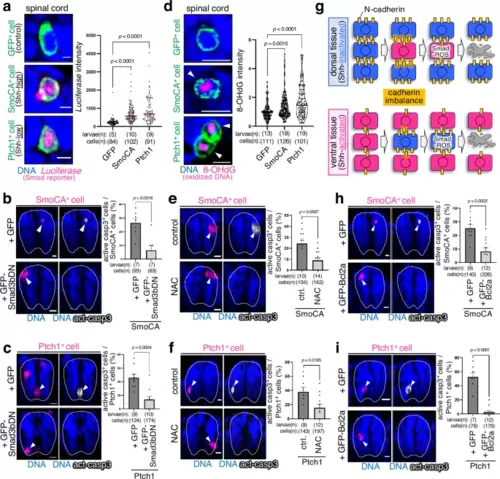
Smad-reactive oxygen species pathway mediates the killing of unfit cells. a, d Shh-unfit cells activate the Smad2/3/4-dependent reporter gene (SBE-Luc) (a) and reactive oxygen species (ROS) production (d). Confocal images show whole-mount fluorescent in situ hybridisation of luciferase mRNA (a) and immunostaining for 8-OHdG (d) (magenta) in mosaic larvae expressing membrane GFP alone or with SmoCA or Ptch1 (green). Scale bar = 10 μm. In a, the luciferase intensity of each GFP+ cell is plotted. Two-tailed one-way ANOVA was used. In d, violin plots show the 8-OHdG intensity of each GFP+ cell. Two-tailed one-way ANOVA was used. b, c, e, f, h, i Smad3bDN overexpression (b, c), ROS inhibition (e, f), and Bcl2a overexpression (h, i) blocked SmoCA- or Ptch1-expressing cell apoptosis. Confocal images show whole-mount immunostaining of active caspase-3 (grey) in mosaic larvae expressing mKO2 with SmoCA or Ptch1 (magenta), injected with GFP or GFP-Smad3bDN (b, c), treated with D2W (control) or N-acetyl-l-cysteine (NAC, a ROS scavenger) (e, f), or injected with GFP or GFP-Bcl2a (h, i). Scale bar = 10 μm. The graphs on the right show the mean + SEM of mKO2+ (SmoCA, Ptch1) and caspase-3-active cell frequencies. An unpaired two-tailed t-test was used for the statistical analysis. g Schematic diagram showing the elimination of Shh-unfit cells. Source data are provided as a Source Data file. |
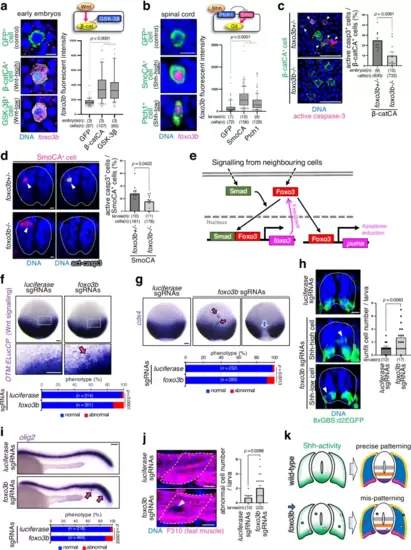
Foxo3b is a common marker of cell competition. Artificially introduced Wnt-unfit cells into early embryos (9 hpf) (a) and Shh-unfit cells in the developing spinal cord (24 hpf) (b) strongly express foxo3b. Confocal images show whole-mount fluorescent in situ hybridisation of foxo3b mRNA (magenta) in GFP alone or with β-catCA, GSK-3β, SmoCA, or Ptch1 (green). foxo3b intensity of each GFP+ cell was graphed. Maximum and minimum: whiskers; medians: lines; 10th and 90th percentiles: boxes. Two-tailed one-way ANOVA was used. c, d Eliminating Wnt- and Shh-unfit cells require foxo3b. Representative confocal images show mosaic embryos expressing GFP-tagged β-catCA (green), mKO2-tagged SmoCA (magenta), and active caspase-3 (magenta in (c), grey in (d)) in foxo3b heterozygous (foxo3b+/-) or homozygous (foxo3b-/-) mutants. The graph on the right shows the mean + SEM of β-catCA+ or SmoCA+, caspase-3 active cell frequencies. An unpaired two-tailed t-test was used for the statistical analysis. e Schematic illustration of the Smad-Foxo3 signalling. f, h foxo3b inhibition enhances Wnt- and Shh-unfit cell accumulation. Whole-mount in situ hybridisation of ELuc in Tg(OTM:ELucCP) embryos (f) or immunostaining of d2EGFP (green) in Tg(8xGBS:d2EGFP) larvae (h) injected with luciferase or foxo3b sgRNAs (foxo3b KO). The bar plots show unfit cell frequencies in each sample. The chi-square test and an unpaired two-tailed t-test were used for statistical analyses in (f, h), respectively. g, i, j foxo3b-mediated unfit cell elimination is required for precise tissue patterning. Representative images show the whole-mount in situ hybridisation of cdx4 (g) or olig2 (i) and immunostaining for fast myosin (j) injected with luciferase or foxo3b sgRNAs. The bottom graph in (g, i) show the percentages of embryos/larvae with normal or abnormal expression patterns. The chi-square test was used for statistical analysis (g, i). The graph to the right of j shows the mean + SEM of abnormal gene expressing-cell frequencies in each larva. An unpaired two-tailed t-test was used for the statistical analysis. k Precise morphogen gradient formation and tissue patterning require foxo3b activity. Scale bar = 10 μm in (a, b, d, h, j), and 100 μm in (c, f, g, i). Source data are provided as a Source Data file. |
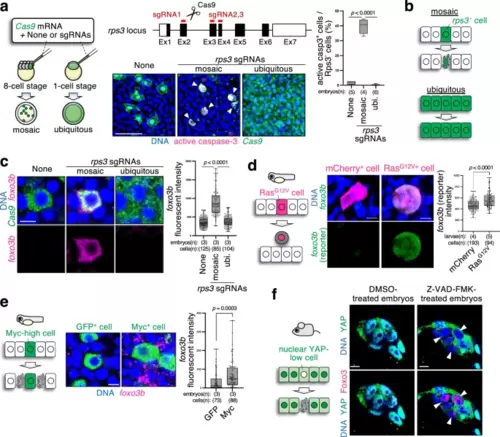
Foxo3 is a universal marker of cell competition. a Cell competition eliminates rps3 mutant cells. The schematic diagram on the left shows the experimental introduction of rps3 mutant cells into zebrafish embryos in a mosaic or ubiquitous manner using CRISPR/Cas9-mediated genome editing. Confocal images show whole-mount immunostaining of embryos (9 hpf) without rps3 mutants (none) or with mosaic or ubiquitous rps3 mutants (green) and active caspase-3 (magenta). Scale bar = 100 µm. The box plot on the right shows the mean + SEM of the GFP+ and caspase-3 active cell frequencies. Maximum and minimum: whiskers; medians: lines; 25th and 75th percentiles: boxes. Two-tailed one-way ANOVA was used. b Schematic illustration indicating that rps3 mutant cells are eliminated by competition with neighbouring normal cells. c rps3 mutant cells upregulate foxo3b. Representative images show whole-mount in situ hybridisation of foxo3b mRNA (magenta) in embryos without rps3 mutants (none) or with mosaic or ubiquitous rps3 mutants (green). Scale bar = 10 μm. d Oncogenic RasG12V cells show upregulated foxo3b expression. Confocal images show endogenous foxo3b (green) expression in Tg(foxo3b:GFP) 24 hpf larvae expressing mCherry alone or with RasG12V. Scale bar = 10 μm. e Myc-surrounding cells upregulate foxo3b. Myc-high cells communicate with and induce apoptosis in the surrounding Myc-low cells. Representative images show whole-mount in situ hybridisation of foxo3b mRNA (magenta) in mosaic embryos (9 hpf) expressing GFP alone or with Myc. Scale bar = 10 μm. In the box plot on the right shows the mean + SEM of the foxo3b intensity of each GFP+ cell (c), mCherry+ cell (d), and cells neighbouring GFP+ cell (e). Maximum and minimum: whiskers; medians: lines; 25th and 75th percentiles: boxes. An unpaired wo-tailed one-way ANOVA was used. f Nuclear YAP-low loser cells in mouse pre-implantation epiblast express Foxo3. Representative images show whole-mount immunostaining for YAP (green) and Foxo3 (magenta) in DMSO-treated (control) or Z-VAD-FMK-treated (apoptosis-inhibited) embryos. Note that most of the cells in DMSO-treated embryos are nuclear YAP-high and Foxo3-low, but Z-VAD-FMK treatment increased nuclear YAP-low and Foxo3-high cells. Scale bar = 10 μm. Source data are provided as a Source Data file. |