
Fig. 6
- ID
- ZDB-FIG-250122-7
- Publication
- Matsumoto et al., 2024 - Foxo3-mediated physiological cell competition ensures robust tissue patterning throughout vertebrate development
- Other Figures
- All Figure Page
- Back to All Figure Page
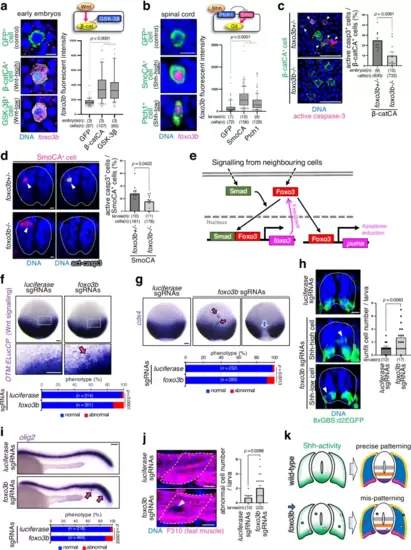
Foxo3b is a common marker of cell competition. Artificially introduced Wnt-unfit cells into early embryos (9 hpf) (a) and Shh-unfit cells in the developing spinal cord (24 hpf) (b) strongly express foxo3b. Confocal images show whole-mount fluorescent in situ hybridisation of foxo3b mRNA (magenta) in GFP alone or with β-catCA, GSK-3β, SmoCA, or Ptch1 (green). foxo3b intensity of each GFP+ cell was graphed. Maximum and minimum: whiskers; medians: lines; 10th and 90th percentiles: boxes. Two-tailed one-way ANOVA was used. c, d Eliminating Wnt- and Shh-unfit cells require foxo3b. Representative confocal images show mosaic embryos expressing GFP-tagged β-catCA (green), mKO2-tagged SmoCA (magenta), and active caspase-3 (magenta in (c), grey in (d)) in foxo3b heterozygous (foxo3b+/-) or homozygous (foxo3b-/-) mutants. The graph on the right shows the mean + SEM of β-catCA+ or SmoCA+, caspase-3 active cell frequencies. An unpaired two-tailed t-test was used for the statistical analysis. e Schematic illustration of the Smad-Foxo3 signalling. f, h foxo3b inhibition enhances Wnt- and Shh-unfit cell accumulation. Whole-mount in situ hybridisation of ELuc in Tg(OTM:ELucCP) embryos (f) or immunostaining of d2EGFP (green) in Tg(8xGBS:d2EGFP) larvae (h) injected with luciferase or foxo3b sgRNAs (foxo3b KO). The bar plots show unfit cell frequencies in each sample. The chi-square test and an unpaired two-tailed t-test were used for statistical analyses in (f, h), respectively. g, i, j foxo3b-mediated unfit cell elimination is required for precise tissue patterning. Representative images show the whole-mount in situ hybridisation of cdx4 (g) or olig2 (i) and immunostaining for fast myosin (j) injected with luciferase or foxo3b sgRNAs. The bottom graph in (g, i) show the percentages of embryos/larvae with normal or abnormal expression patterns. The chi-square test was used for statistical analysis (g, i). The graph to the right of j shows the mean + SEM of abnormal gene expressing-cell frequencies in each larva. An unpaired two-tailed t-test was used for the statistical analysis. k Precise morphogen gradient formation and tissue patterning require foxo3b activity. Scale bar = 10 μm in (a, b, d, h, j), and 100 μm in (c, f, g, i). Source data are provided as a Source Data file. |