
Fig. 4
- ID
- ZDB-FIG-250122-5
- Publication
- Matsumoto et al., 2024 - Foxo3-mediated physiological cell competition ensures robust tissue patterning throughout vertebrate development
- Other Figures
- All Figure Page
- Back to All Figure Page
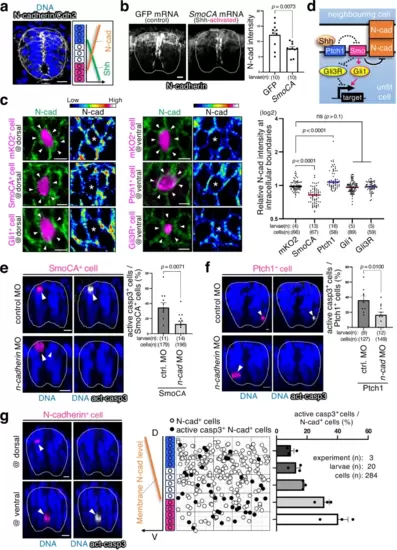
N-cadherin mediates the sensing of unfit cells. a N-cadherin/Cdh2 levels inversely correlate with Shh activity. Representative images show whole-mount immunostaining for N-cadherin (grey). Scale bar = 10 μm. b Activating Shh signalling reduces N-cadherin levels. Shh-activated larvae were prepared by injecting SmoCA mRNA. Scale bar = 10 μm. The mean + SEM of N-cadherin intensity of each larva is graphed. An unpaired two-tailed t-test was used for the statistical analysis. c Mosaic introduction of SmoCA- or Ptch1-expressing cells altered endogenous N-cadherin levels. Confocal images show whole-mount immunostaining for N-cadherin (green) and mosaic expression of mKO2 alone or with SmoCA, Ptch1, Gli1, or Gli3R (magenta). The fluorescence intensity of intercellular N-cadherin staining between mKO2+ cells and neighbouring wild-type cells was normalised to the intercellular fluorescence intensity between wild-type cells. Each dot represents an mKO2+ cell. Two-tailed one-way ANOVA was used. d Schematic illustration of the Shh signalling pathway and N-cadherin regulation. e, f Partial N-cadherin knockdown by injecting low-dose n-cadherin oligo morpholino (MO) blocks SmoCA- (e) or Ptch1- (f) -expressing cell elimination. Scale bar = 10 μm. The graphs on the right show the mean + SEM of mKO2+ (SmoCA, Ptch1) and caspase-3-active cell frequencies. An unpaired two-tailed t-test was used for the statistical analysis. g Cells causing excess noise in N-cadherin-gradients efficiently underwent apoptosis. Confocal images show whole-mount immunostaining of mosaically introduced N-cadherin-overexpressing cells (magenta) and active caspase-3 (grey). Scale bar = 10 μm. The middle panel shows maps of N-cadherin cells artificially introduced into the spinal cord. The right graph indicates the mean + SEM of mKO2+ and caspase-3-active cell frequencies within a divided range along the DV axis. Source data are provided as a Source Data file. |