
|
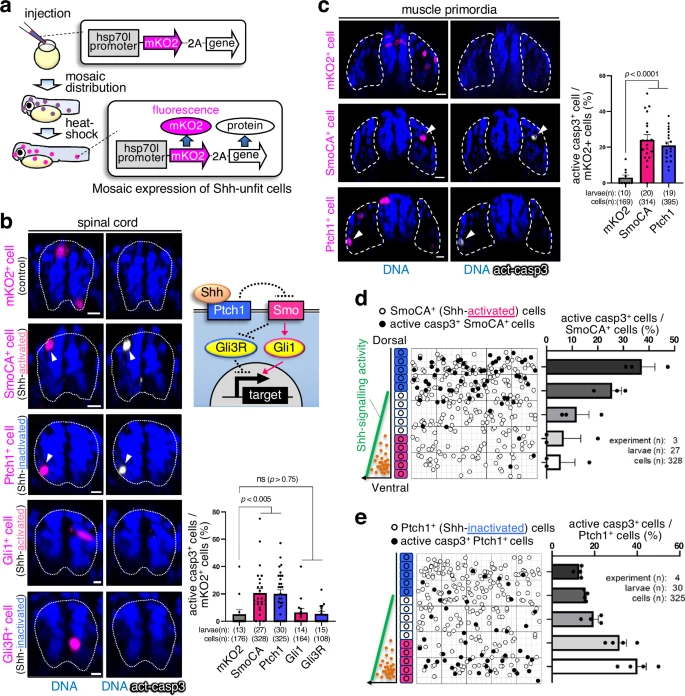
Fig. 3 Substantial differences in Shh-activity trigger apoptosis. a Schematic diagram of the experimental introduction of abnormal fluorescent Shh signalling cells into zebrafish larvae in a mosaic manner through heat shock induction. b, c Artificially introduced SmoCA-expressing (Shh-activated) or Ptch1-overexpressing (Shh-inactivated) cells underwent apoptosis, but Gli1- or Gli3R-expressing cells did not undergo apoptosis in the spinal cord (b) and muscle (c). Confocal microscopy images show whole-mount immunostaining of active caspase-3 (grey) in mosaic larvae expressing mKO2 alone or with SmoCA, Ptch1, Gli1, or Gli3R (magenta). Arrowheads indicate caspase-3 active cells. Scale bar = 10 μm. Bar plots show the mean + SEM of the mKO2+ and caspase-3-active cell frequencies. Two-tailed one-way ANOVA was used for the statistical analysis. d, e Cells causing substantial noise in the Shh gradient efficiently underwent apoptosis. The left panels show maps of artificially introduced SmoCA- or Ptch1-expressing cells in the zebrafish spinal cord. The graphs on the right show the mean + SEM of mKO2+ and caspase-3-active cell frequencies within a divided range along the dorso-ventral (DV) axis. Source data are provided as a Source Data file.