
- Title
-
3-Chloro-1,2-Propanediol Exposure Induces Cardiotoxicity and Behavioural Abnormalities in Zebrafish Embryos
- Authors
- Wang, J., Yuan, Q., Hu, W., Ye, Z., Zhang, L., Wang, Z., Liu, J., Huang, L., Liu, F., Liao, X., Xiao, J., Zhang, S., Cao, Z.
- Source
- Full text @ Env. Tox.
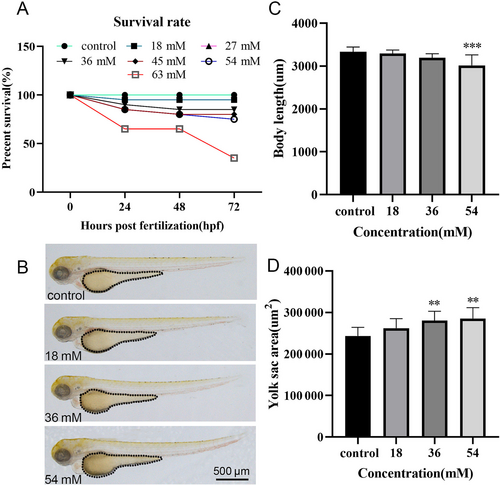
Zebrafish developmental toxicity induced by 3-MCPD exposure. (A) Survival rate of 24, 48, and 72?hpf zebrafish exposed to different concentrations. (B) Morphological changes in zebrafish exposed to 3-MCPD (0, 18, 36, 54?mM) for 72?hpf. (C) Body length of juvenile zebrafish exposed to 3-MCPD (0, 18, 36, 54?mM) for 72?hpf. (D) Yolk sac area of zebrafish juveniles exposed to 3-MCPD (0, 18, 36, 54?mM) for 72?hpf. (n?=?20, **p? |

3-MCPD induced defects in cardiac development (A) Representative bright-field and fluorescence images of zebrafish hearts following exposure to 18, 36, and 54?mM 3-MCPD for 72?hpf. (B) Zebrafish heart rate (20?s) after exposure to 18, 36, and 54?mM 3-MCPD for 72?hpf. (C) Pericardial area of zebrafish after exposure to 18, 36, and 54?mM 3-MCPD for 72?hpf. (D) SV-BA distance of zebrafish after exposure to 18, 36, and 54?mM 3-MCPD for 72?hpf. (E) Confocal images of cardiomyocytes and endocardium after exposure to control and 54?mM 3-MCPD for 72?hpf. (F) Fluorescence images capturing zebrafish blood vessels following exposure to 18, 36, and 54?mM 3-MCPD for 72?hpf. (n?=?20, **p? |
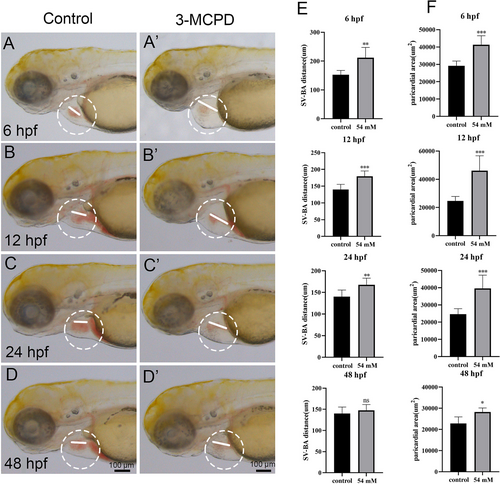
Effects of 3-MCPD exposure on hearts at different developmental stages. (A?D') Representative bright-field images of zebrafish exposed for 6, 12, 24, 48?hpf. (E and F) Pericardial area and SV-BA distance of both zebrafish control and exposure groups after exposure at each time period, respectively. (n?=?20, *p? |
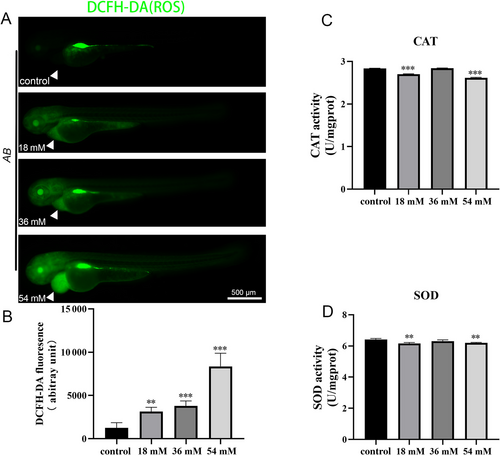
Oxidative stress induced by 3-MCPD exposure. (A) ROS staining of zebrafish larvae exposed to 18, 36, and 54?mM 3-MCPD. (B) The fluorescence intensity of the heart area after ROS staining in the control group and the exposure group (n?=?20, **p? |

Apoptosis induced by 3-MCPD exposure. (A) Acridine orange staining of zebrafish larvae exposed to 18, 36, and 54?mM 3-MCPD 72?hpf. (B) number of apoptotic cells. (C) Qpcr detection of related apoptosis genes (MDM2, bax, bcl-2, p53, bax/bcl-2) expression level. (n?=?20, **p? |
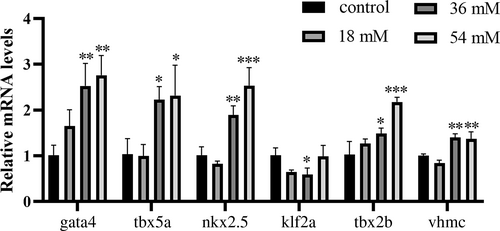
Expression analysis of cardiac-related genes post 3-MCPD exposure. Examination of expression levels for cardiac-related genes (gata4, tbx5a, nkx2.5, klf2a, tbx2b, vhmc) in zebrafish exposed to 18, 36, and 54?mM 3-MCPD for 72?hpf via qpcr. (n?=?20, *p? |
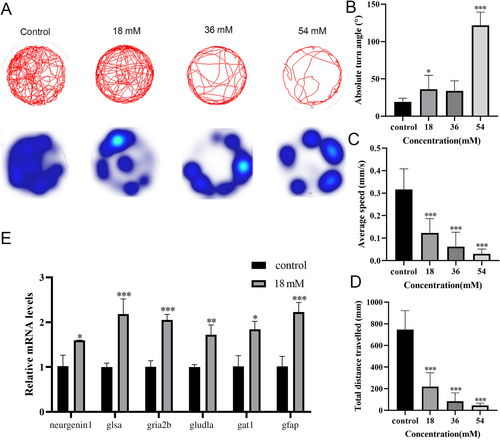
Effects of 3-MCPD exposure on behavioral patterns. (A) Behavioral trajectory analysis (upper) Analysis of residence time in different regions (lower). (B) Absolute rotation angle analysis. (C) Average speed analysis. (D) Total movement distance analysis. (E) Qpcr analysis of nerve-related genes Expression level detection. (n?=?20, *p? |