
Image
|
Figure Caption
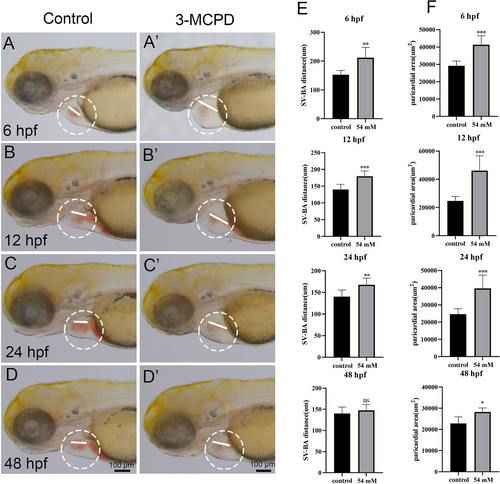
Fig. 3 Effects of 3-MCPD exposure on hearts at different developmental stages. (A–D') Representative bright-field images of zebrafish exposed for 6, 12, 24, 48 hpf. (E and F) Pericardial area and SV-BA distance of both zebrafish control and exposure groups after exposure at each time period, respectively. (n = 20, *p < 0.05, **p < 0.01, ***p < 0.001, ns represents no significance, mean ± S.D).
Acknowledgments
This image is the copyrighted work of the attributed author or publisher, and
ZFIN has permission only to display this image to its users.
Additional permissions should be obtained from the applicable author or publisher of the image.
Full text @ Env. Tox.