
Image
|
Figure Caption
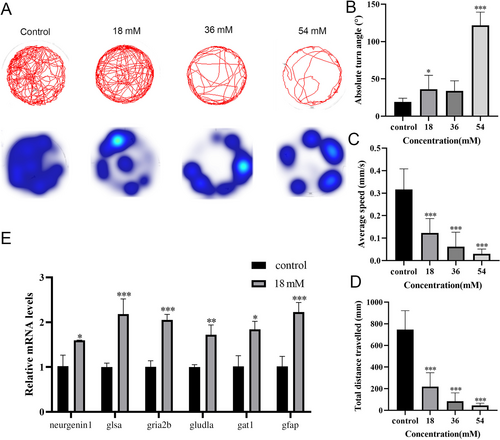
Fig. 7 Effects of 3-MCPD exposure on behavioral patterns. (A) Behavioral trajectory analysis (upper) Analysis of residence time in different regions (lower). (B) Absolute rotation angle analysis. (C) Average speed analysis. (D) Total movement distance analysis. (E) Qpcr analysis of nerve-related genes Expression level detection. (n = 20, *p < 0.05, **p < 0.01, ***p < 0.001, mean ± S.D).
Acknowledgments
This image is the copyrighted work of the attributed author or publisher, and
ZFIN has permission only to display this image to its users.
Additional permissions should be obtained from the applicable author or publisher of the image.
Full text @ Env. Tox.