
Image
|
Figure Caption
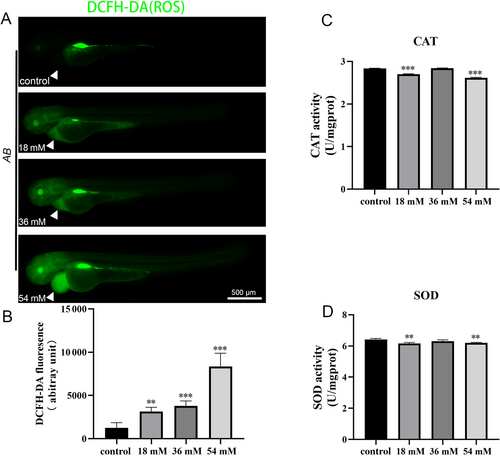
Fig. 4 Oxidative stress induced by 3-MCPD exposure. (A) ROS staining of zebrafish larvae exposed to 18, 36, and 54 mM 3-MCPD. (B) The fluorescence intensity of the heart area after ROS staining in the control group and the exposure group (n = 20, **p < 0.01, ***p < 0.001, mean ± S.D). (C) Effects of 3-MCPD exposure on CAT contents. (D) Effects of 3-MCPD exposure on SOD contents. (n = 80, **p < 0.01, ***p < 0.001, mean ± S.D).
Acknowledgments
This image is the copyrighted work of the attributed author or publisher, and
ZFIN has permission only to display this image to its users.
Additional permissions should be obtained from the applicable author or publisher of the image.
Full text @ Env. Tox.