
- Title
-
CRISPR-Cas13d as a molecular tool to achieve targeted gene expression knockdown in chick embryos
- Authors
- Kim, M., Hutchins, E.J.
- Source
- Full text @ Dev. Biol.
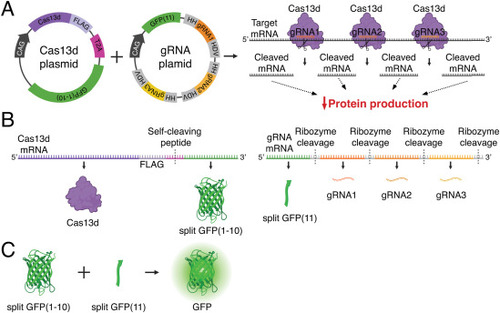
Delivery strategy of a two-plasmid CRISPR-Cas13d system for avian embryos. (A) Schematic depicting structure of Cas13d and guide RNA (gRNA) plasmids and the in vivo knockdown effect. Plasmid expression is driven by a ubiquitous promoter (CAG). Cas13d protein and gRNAs form ribonucleoprotein complexes to cleave target mRNA at multiple sites across the coding region, ultimately resulting in disrupted translation and decreased protein production. (B) The Cas13d plasmid generates a FLAG-tagged Cas13d protein and a split GFP(1?10) non-fluorescent reporter protein, separated by a T2A self-cleaving peptide. The gRNA plasmid generates a split GFP(11) non-fluorescent reporter protein, and three unique gRNAs flanked by ribozyme sequences (HH and HDV) that separate the transcribed components. (C) When co-expressed, the split GFP non-fluorescent reporters GFP(1?10) and GFP(11) self-complement into a functional, fluorescent GFP reporter protein to label cells that have successfully received both plasmids. HH, hammerhead ribozyme sequence; HDV, hepatitis delta virus ribozyme sequence. |
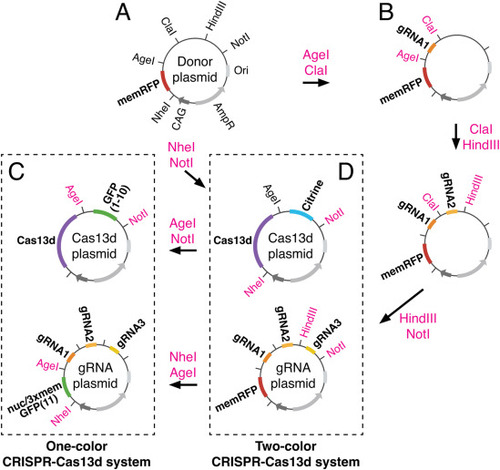
Sequential cloning strategy used to generate one- and two-color CRISPR-Cas13d systems. (A) Donor plasmid supplying the backbone vector contains the following features: Origin of replication (Ori), Ampicillin resistance (AmpR), ubiquitous promoter (CAG), and a membrane-localized RFP reporter (memRFP), as well as a multiple cloning site. Relevant restriction sites are shown. (B-D) Donor plasmid was digested with indicated restriction enzymes and ligated iteratively to insert three guide RNAs (gRNAs). Three variations of the gRNA plasmid were created: one containing memRFP for a two-color system (D), and two others containing split GFP(11) reporters that are either nuclear (nucGFP(11)) or membrane localized (3xmemGFP(11)) for a one-color system (C). Donor plasmid was also separately digested with indicated restriction enzymes and ligated with respective inserts to create two variations of the Cas13d plasmid: one containing a split GFP reporter (GFP(1?10)) for the one-color system (C), and the other containing a Citrine reporter for the two-color system (D). (For interpretation of the references to color in this figure legend, the reader is referred to the Web version of this article.) |
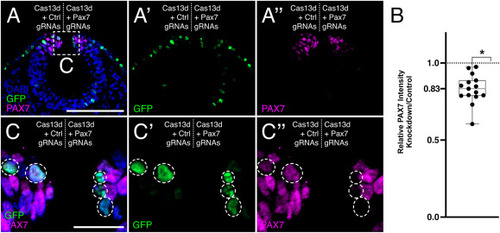
One-color CRISPR-Cas13d-mediated PAX7 knockdown. (A) A representative transverse cross-section of a HH9 chick embryo head bilaterally electroporated with Cas13d + Control guide RNA (gRNA) plasmids (left), and Cas13d + Pax7 gRNA plasmids (right). Reduced PAX7 intensity is observed on the right side of the embryo. Scale bar, 100 ?m. (B) Quantification of PAX7 knockdown. Each data point represents the relative PAX7 intensity detected on the right side of an embryo (PAX7 knockdown) compared to the left side of the same embryo (contralateral control). The relative intensity measurements for each embryo are averages of the intensities detected from three nonadjacent cross-sections. A statistically significant reduction in PAX7 intensity is observed (83.1 � 2.4% of the contralateral control side; n = 15 embryos) with CRISPR-Cas13d-mediated knockdown. ?, p < 0.0001; one-sample Wilcoxon signed-rank test. (C) Enlarged view of boxed area shown in (A). GFP+ cells are highlighted by white circles. Only the GFP+ cells (C?) on the right side of the embryo show reduction in PAX7 intensity (C?). Scale bar, 20 ?m. (For interpretation of the references to color in this figure legend, the reader is referred to the Web version of this article.) |

A comparison of morpholino- and CRISPR-Cas13d-mediated PAX7 knockdown approaches. (A-D) Representative maximum intensity projections of HH9+ chick embryos electroporated with morpholino (MO) or CRISPR-Cas13d reagents and immunostained for PAX7 (magenta). (A) MO knockdown embryos were bilaterally electroporated with a control morpholino (Ctrl MO) and an RFP reporter (left), and Pax7 MO and a GFP reporter (right). (B) Representative transverse cross-section of embryo shown in (A). (C) One-color CRISPR-Cas13d knockdown embryos were electroporated with Cas13d + Control gRNA plasmids (left), and Cas13d + Pax7 gRNA plasmids (right), using split GFP fluorescence to indicate co-expression of both plasmids. Cyan outlines the area of PAX7+ cells, which is used to calculate the area of neural crest migration. (D) Representative transverse cross-section of embryo shown in (C). (E) Quantification of the neural crest migration defect. Each data point represents the relative area of neural crest migration away from the midline, indicated by PAX7+ cells, detected on the right side of an embryo (PAX7 knockdown) compared to the left side of the same embryo (contralateral control). A statistically significant reduction in PAX7+ migration area is observed with MO-mediated knockdown of PAX7 (80.0 � 4.1% of PAX7+ cell migration area compared to control; n = 11 embryos). ?, p = 0.0029, one-sample Wilcoxon signed-rank test. Similarly, a statistically significant reduction in PAX7+ migration area is also observed with CRISPR-Cas13d-mediated knockdown of PAX7 (75.5 � 4.5% of PAX7+ cell migration area compared to control; n = 13 embryos). ?, p = 0.0012, one-sample Wilcoxon signed-rank test. Notably, the defects observed in neural crest migration for the two modes of knockdown are not different. ns, nonsignificant; p = 0.2066, Mann-Whitney test. Scale bar, 100 ?m. (For interpretation of the references to color in this figure legend, the reader is referred to the Web version of this article.) |
Reprinted from Developmental Biology, , Kim, M., Hutchins, E.J., CRISPR-Cas13d as a molecular tool to achieve targeted gene expression knockdown in chick embryos, , Copyright (2024) with permission from Elsevier. Full text @ Dev. Biol.