
- Title
-
Chronic Exposure of Zebrafish to Iron and Aluminum: Evaluation of Reversal and Generational Transposition of Behavioral, Histopathological, and Genotoxic Changes
- Authors
- Rodrigues, G.Z.P., Finkler, M., Dos Santos, T.G., Kayser, J.M., Lima, D.D.D., Burghausen, J.H., de Oliveira, D.L., Ziulkoski, A.L., Gehlen, G.
- Source
- Full text @ Env. Tox.

Schematic figure of the experimental design of the study. |
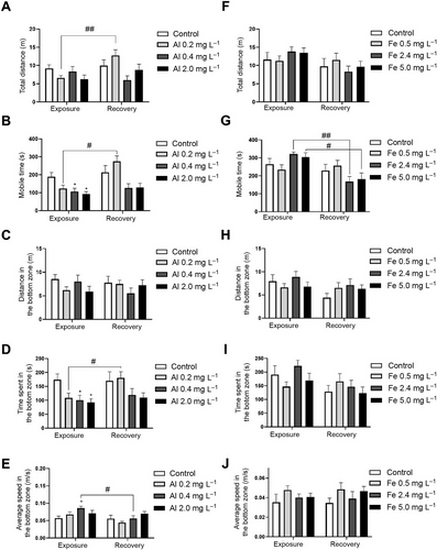
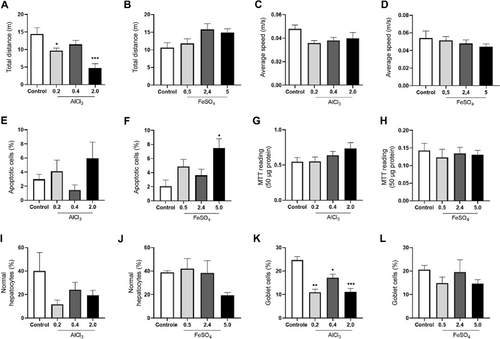
Behavioral parameters evaluated in zebrafish exposed to Al (A?E) and Fe (F?J). Statistical differences to the control are represented by asterisks (*p? |
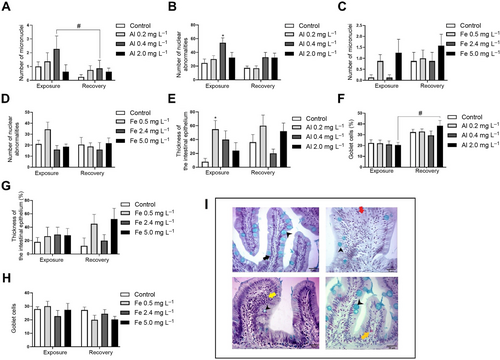
Genotoxicity parameters (n?=?8) evaluated in zebrafish exposed to Al (A,B) and Fe (C,D). Histopathology performed on intestines (n?=?5) of the animals (E?I). In figure (I), black arrows represent normal intestinal villi, arrowhead: goblet cells; yellow arrow: blood cell infiltrate associated with increased epithelial thickness; red arrow: villous fusion and orange arrow: presence of eosinophil. Statistical differences to the control are represented by asterisks (*p? |

Histopathological analysis was performed on livers zebrafish (n?=?5) exposed to Al (A?C) and Fe (D,F). In figure (G), the normal structural organization of the organ can be observed, whereas in figure (H,I) the main hepatocyte alterations are illustrated, namely: vacuolization and degeneration (only non-parametric data), respectively. Statistical differences to the control are represented by asterisks (*p? |
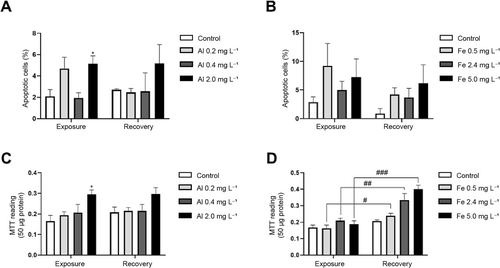
Percentage of TUNEL-stained apoptotic cells in zebrafish telencephalon (n?=?4) exposed to Al and Fe (A,B). Telencephalic mitochondrial activity demonstrated by MTT assay (n?=?6) (C,D). Statistical differences to the control are represented by asterisks (*p? |
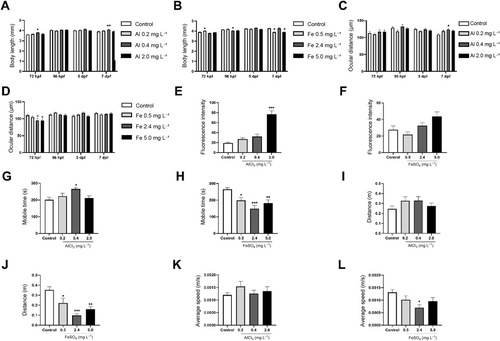
Morphometric parameters evaluated in the offspring of parents exposed to Al and Fe (n?=?10) (A?D). Fluorescence intensity assessed on apoptosis labeling (n?=?10) (E,F) and behavioral (n?=?20) parameters (G?L). Statistical differences to the control are represented by asterisks (*p? |
Behavioral parameters evaluated (n?=?30) in the offspring of parents exposed to Al and Fe (A?D). Percentage of telencephalic apoptotic cells (n?=?4) (E,F) and telencephalic mitochondrial activity (n?=?6) (G,H). Histopathological parameters evaluated (I?L). Statistical differences to the control are represented by asterisks (*p? |