
Fig. 3
- ID
- ZDB-FIG-250422-48
- Publication
- Rodrigues et al., 2024 - Chronic Exposure of Zebrafish to Iron and Aluminum: Evaluation of Reversal and Generational Transposition of Behavioral, Histopathological, and Genotoxic Changes
- Other Figures
- All Figure Page
- Back to All Figure Page
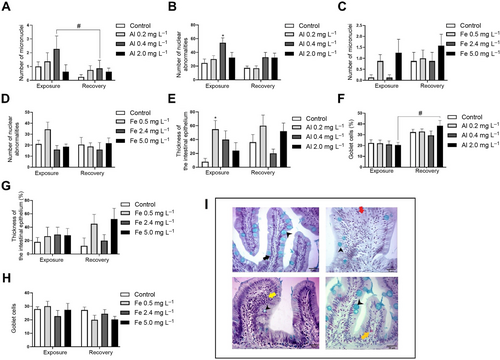
Genotoxicity parameters (n = 8) evaluated in zebrafish exposed to Al (A,B) and Fe (C,D). Histopathology performed on intestines (n = 5) of the animals (E–I). In figure (I), black arrows represent normal intestinal villi, arrowhead: goblet cells; yellow arrow: blood cell infiltrate associated with increased epithelial thickness; red arrow: villous fusion and orange arrow: presence of eosinophil. Statistical differences to the control are represented by asterisks (*p < 0.05; **p < 0.005; and ***p < 0.0001), and the differences between exposure X recovery are represented by the pound (# p < 0.05; ## p < 0.005; ### p < 0.0001). Two-way ANOVA followed by Sidak's multiple comparison test was used to verify statistical differences between the same group from different experiments (exposure X recovery) and one-way ANOVA followed by Tukey's Honest Significant Difference was used to verify statistical differences between the different groups from exposure or recovery |