
|
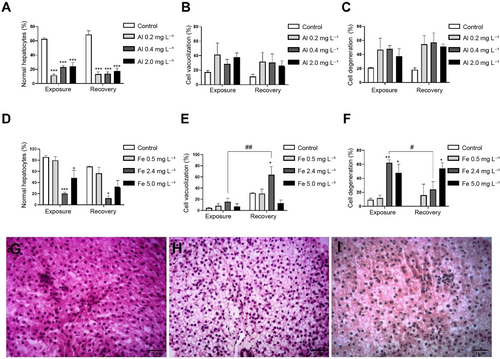
Fig. 4 Histopathological analysis was performed on livers zebrafish (n = 5) exposed to Al (A–C) and Fe (D,F). In figure (G), the normal structural organization of the organ can be observed, whereas in figure (H,I) the main hepatocyte alterations are illustrated, namely: vacuolization and degeneration (only non-parametric data), respectively. Statistical differences to the control are represented by asterisks (*p < 0.05; **p < 0.005; and ***p < 0.0001), and the differences between exposure X recovery are represented by the pound (# p < 0.05; ## p < 0.005; ### p < 0.0001). Two-way ANOVA followed by Sidak's multiple comparison test was used to verify statistical differences between the same group from different experiments (exposure X recovery) and one-way ANOVA followed by Tukey's Honest Significant Difference was used to verify statistical differences between the different groups from exposure or recovery. The data had non-parametric distribution (vacuolization and degeneration of hepatocytes), in which the Kruskal–Wallis test was applied, followed by Dunn's post hoc.