
|
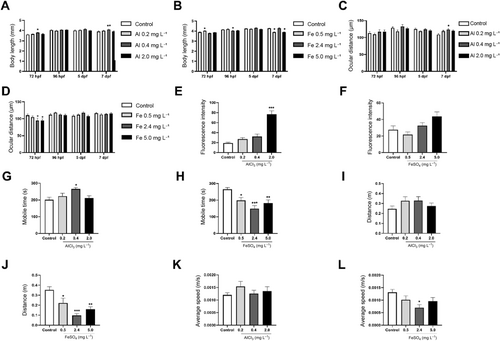
Fig. 6 Morphometric parameters evaluated in the offspring of parents exposed to Al and Fe (n = 10) (A–D). Fluorescence intensity assessed on apoptosis labeling (n = 10) (E,F) and behavioral (n = 20) parameters (G–L). Statistical differences to the control are represented by asterisks (*p < 0.05; **p < 0.005; and ***p < 0.0001). Two-way ANOVA followed by Sidak's multiple comparison test was used to verify statistical differences between the same group from different experiments (exposure X recovery) and one-way ANOVA followed by Tukey's Honest Significant Difference was used to verify statistical differences between the different groups from exposure or recovery.