Morphodynamic characterization of delamination events in the adult pallium. (A) Schematics of delamination events observed using intravital imaging in Tg(gfap:Zo1-mKate2) 3 mpf adults (apical views). Horizontal arrows indicate imaging time points (tp); red indicates Zo1; blue indicates the apical surface of a delaminating cell; red stars indicate non-delaminating neighbors. Top: Tracking with ≥4 tp (14-16 days) without visible division prior to delamination termination. tp0, first tp of the movie; tpsh, apical size shrinkage onset. Bottom: Division event taking place ≤3 tp (≤13 days) before delamination termination. tp0, first time point post-division. (B) Snapshots of two delamination events recorded from a Casper;Tg(gfap:hZo1-mKate);Tg(deltaA:egfp) 3 mpf adult (fish Outi; raw data taken from Mancini et al., 2023) (Zo1-mKate channel only, red). White arrows indicate delaminating cells; red frame highlights delamination termination; vertical time ticks indicate imaging tp (bottom) and corresponding days (top). Apical area of cells in examples 1 and 2: 20.1 µm2 and 22.9 µm2, respectively. Insets show images including the deltaA:eGFP channel (cyan) at shrinkage onset. (C-E) Quantified dynamic parameters of delaminations occurring >4 tp without division (red) and ≤3 tp post-division (black). (C) Apical surface area at tp preceding delamination termination. Mann–Whitney test, P=0.661. (D) Apical surface area at tpsh as a function of the duration between tpsh and delamination termination. Linear regression, R2=0.256. (E) Speed of apical size reduction calculated from tpsh until delamination termination. Mann–Whitney test, P=0.849. ns, not significant.

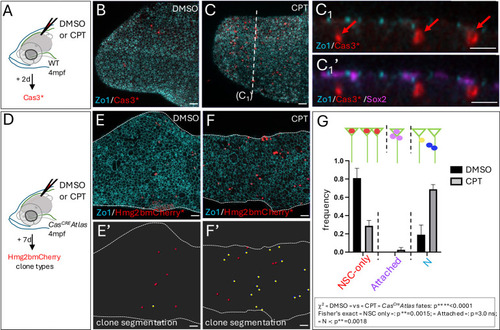
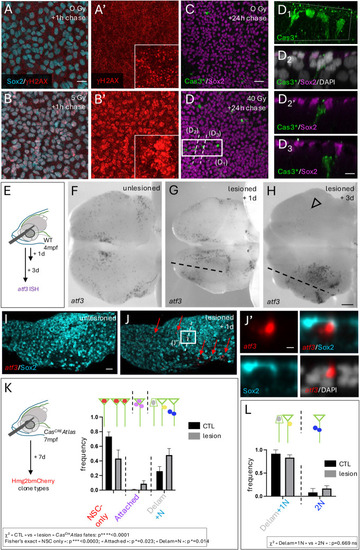
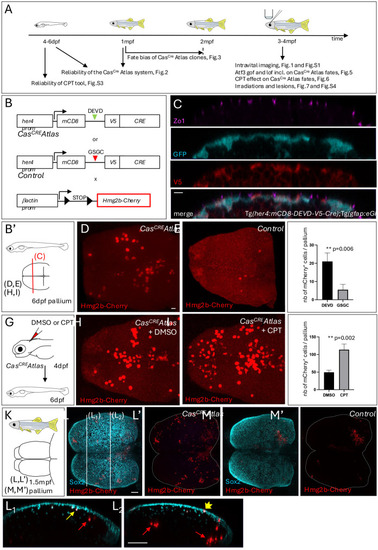
CasCREAtlas reveals non-apoptotic caspase events during pallium development and homeostasis. (A) Experiments carried out in the present study shown in relation to the zebrafish lifetime. (B) Schematics of the transgenic lines used. CasCREAtlas combines an NP/NSC-specific driver line (top and middle) expressing Cre upon Cas3*/Cas7* cleavage and a reporter line (bottom) expressing hmg2bmCherry upon Cre recombination. mCD8, membrane anchor; V5, antigen segment (tag); DEVD, canonical Cas3*/Cas7* cleavage site; GSGC, non-productive cleavage site; her4 prom, her4 regulatory elements. The Tg(her4:mCD8-DEVD-V5-Cre);Tg(βact;lox-stop-lox-hmg2bmCherry) background is referred to as CasCREAtlas, and Tg(her4:mCD8-GSGC-V5-Cre);Tg(βact;lox-stop-lox-hmg2bmCherry) as ‘control’. All analyses were conducted in double heterozygotes. (B′) Schematic of analyses in cross-sectioned or whole-mount pallia at 6 dpf. (C) Expression of the CasCRE driver is confined to gfap:eGFP-positive cells. Pallial cross-sections of Tg(her4:mCD8-DEVD-V5-Cre);Tg(gfap;eGFP) larvae at 6 dpf with IHC for GFP (NP/NSC), Zo1 (tight junctions, delimiting apical surfaces) and V5 (transgene tag), showing V5 (membrane anchored) and GFP in the same cells. (D-F) Hmg2bmCherry whole-mount IHC on CasCREAtlas (D) and control (E) pallia at 6 dpf (dorsal views, z-projections, anterior left); quantification of positive cells (F) (CasCREAtlas: n=4 brains; control: n=10 brains; Mann–Whitney test). (G-J) CasCREAtlas activity is induced by camptothecin (CPT). (G) Schematic of the experiment: CPT (20 µM) or DMSO was injected into the neural tube ventricle in CasCREAtlas larvae at 4 dpf; Hmg2bmCherry was analyzed at 6 dpf. (H-J) Hmg2bmCherry whole-mount IHC at 6 dpf (dorsal views, z-projections, anterior left) and quantification (J) (DMSO and CPT: n=6 brains each; Mann–Whitney test). (K-M′) Hmg2bmCherry expression in CasCREAtlas (L,L′) and control (M,M′) pallia at 1.5 mpf. (K) Schematic of whole-mount pallia at 1.5 mpf. (L-M′) Whole-mount IHC for Sox2 (NPs, NSCs and some freshly born neurons) and Hmg2bmCherry (dorsal views, z-projections, anterior left). L1 and L2 show cross-sections as indicated in L, dorsal up. Red arrows indicate Sox2neg neurons, thin yellow arrow Sox2pos neurons, and short yellow arrow a Sox2pos NSC. Scale bars: 10 µm (C-E,H,I); 50 µm (L-M′,L1,L2).

CasCREAtlas clones in pallial NSCs display a biased fate. (A) Tg(her4:ERT2CreERT2);Tg(βact:lox-stop-lox-hmg2bmCherry);Tg(gfap:eGFP) (top) and CasCREAtlas;Tg(gfap:eGFP) (bottom) triple transgenic fish were used to compare NSC fates. Left: Genotypes. Middle: Schematic of the experiment. Right: Schematic cross-sections with relative positions of the NSC layer (cyan), BrdU-labeled neurons (magenta) and Hmg2bmCherry-positive clones (red) in each genotype. Schematic of the brain on the right (anterior left, dorsal view) shows the position of these schematic cross-sections. (B-B″) IHC for GFP (cyan, NSCs), BrdU (magenta) and Hmg2bmCherry (red) in a cross-section of a CasCREAtlas;Tg(gfap:eGFP) fish. Red arrows point to Hmg2bmCherrypos cells. (C) Whole-mount CasCREAtlas;Tg(gfap:eGFP) 2mpf pallium with IHC for GFP, BrdU and Hmg2bmCherry (dorsal view, anterior left). (D) Frequency of the different Hmg2bmCherrypos clone types (green triangles represent NSCs; colored dots represent Hmg2bmCherrypos cells) generated from her4pos NSCs between 1 and 2 mpf in the her4:ERT2CreERT2 and CasCREAtlas backgrounds (black and gray bars, respectively) (n=5 brains for each; her4:ERT2CreERT2 tracing: 344 clones; CasCREAtlas: 360 clones). Graph displays mean±s.e.m. Statistical analysis for global differences between ERT2CreERT2 and CasCreAtlas fates: contingency χ2 test: ****P<0.0001. Statistical analyses for individual fates among three possible fates [‘NSC only’, ‘attached’, and ‘neurons only’ (one neuron or more)]: Fisher's exact test with Bonferroni correction: NSC only P=2.309; attached: ***P<0.0003; neurons only: *P=0.0384. ns, not significant. Scale bars: 15 µm (B,B′); 30 µm (C).

atf3 is expressed in a subset of NSCs in the adult pallium. (A) atf3pos cells (orange dots, UMI values color-coded) on the scRNAseq UMAP of adult quiescent NSCs (blue dots). NSCs closest to activation and/or neurogenesis commitment and NSCs in deep/long quiescence are indicated (Morizet et al., 2024). (B) Expression of atf3 in whole-mount ISH in the adult pallium (dorsal view, anterior left) with the atf3-L probe shown in E. Da, Dl, Dm, Dp, anterior, lateral, median and posterior pallial domains. Arrows point to atf3pos cells in Dm and Dp. (C1-C4) Optical cross-sections of a Tg(gfap:eGFP) pallium stained in whole-mount for GFP (cyan, IHC), atf3 transcripts (Fast Red) and DAPI (ventricular surface up). Sections are ordered from C1 to C4 along the anteroposterior axis. Red arrows indicate an atf3pos, GFPpos cell (asterisk indicates the nucleus). (D1-D4) Optical horizontal sections of the pallium shown in C. D1 to D4 show superficial to deeper locations in sequence. Red arrows indicate an atf3pos, GFPpos cell. (E) Atf3 protein isoforms predicted from adult pallial transcripts. DBD, DNA-binding domain; E2-E4, coding exons: L, long; LZ, leucine zipper; S, short. Arrows indicate splice junctions for the L form. Yellow box represents the N terminus of the S form (alternative splicing). Scale bars: 100 µm (B); 5 µm (C1-D4).

Atf3 can drive NSC delamination and is needed for the CasCREAtlas fate bias. (A-E) Cell fates expressed by adult pallial ventricular cells at 2 days post-electroporation (dpe). (A-C′) Visual categorization of the three possible fates in whole-mount pallia with IHC for GFP (green, electroporated construct), ZO1 (magenta) and Sox2 (cyan), and counterstaining with DAPI (gray). A-C: Dorsal (apical) views; A′-C′: Cross-sections as indicated in A-C. Arrowhead in B′ indicates apical attachment of a delaminating cell. (D,E) Experimental scheme and quantification of cell fate categories upon electroporation of atf3-L-P2A-nlsGFP versus nlsGFP (D) and atf3-S-P2A-nlsGFP versus nlsGFP (E). Graphs display mean±s.e.m. (D) nlsGFP n=214 cells, atf3-L-P2A-nlsGFP n=69 cells, from 4 and 3 hemipallia, respectively. Statistical analysis for global differences between nlsGFP and atf3-L fates: contingency χ2 test: ****P<0.0001; statistical analyses for individual fates among the three observed possible fates [NSCs (NSC singlets and doublets), single delaminating cells, and single neurons (1N)]: Fisher's exact test with Bonferroni correction: NSC ***P<0.0003; delaminating: P=2.319; neurons only: **P=0.0039. (E) nlsGFP n=62 cells, atf3-S-P2A-nlsGFP n=121 cells, from 2 and 3 hemipallia, respectively. Statistical analysis for global differences between nlsGFP and atf3-S fates: contingency χ2 test: P=0.883. (F-F″) Some NSCs overexpressing Atf3-F in CasCREAtlas double-transgenic adults are also Hmg2bmCherrypos at 7 dpe. IHC for Zo1 (magenta), GFP (cyan, electroporated construct) and Hmg2bmCherry (red) in whole-mount pallium. F′ shows high magnification of the boxed area in F (dorsal views, anterior left); F″ shows magnified cross-section as indicated in F′. White arrows indicate double-positive cells. (G) Exon-intron structure of atf3 (top) and predicted proteins (bottom) produced upon splice blockade by atf3-MO (red bar). E1-E4, exons; I1-I3, introns. Black arrows and arrowhead indicate ATG for Atf3-L (L) and Atf3-S (S), respectively; red arrowhead with double asterisk indicates double stop codon in I2. Color code as in Fig. 4E. (H-K) Atf3-L function blockade in CasCREAtlas. (H) Experimental scheme. (I,J) IHC for Hmg2bmCherry (red) and Sox2 (cyan) in whole-mount CasCREAtlas pallia 7 days after injection of the control MO (CTL MO; I) or atf3-MO (J) (dorsal views). (K) Quantification of the three observed CasCreAtlas clone types: ‘NSC-only’ (single NSCs and NSC doublets), ‘Delam’ (single delaminating cells) and single neurons (‘1N’). Graph displays mean±s.e.m. Statistical analysis for global differences between control MO and atf3 MO: contingency χ2 test: ****P<0.0001; statistical analyses for individual fates among the three observed possible fates: Fisher's exact test with Bonferroni correction: NSC ***P<0.0006; delaminating: P=3.0; 1N: ***P=0.0009. n=6 hemipallia per condition; control MO: n=82 clones; atf3 MO: n=43 clones. ns, not significant. Scale bars: 8 µm (A-C); 50 µm (F,F′); 10 µm (F″); 8 µm (I,J).

Experimentally induced Cas3* events drive direct neuronal differentiation in the adult pallium. (A-C1′) Induction of Cas3* by CPT (C) versus DMSO (B) injected into the cerebral ventricle (A), revealed by IHC in adult pallia at 2 days post-injection (dpi). (B,C) Dorsal whole-mount views (right hemisphere, anterior left) with IHC for Zo1 (cyan), Cas3* (red) and Sox2 (magenta, only shown in C1′). C1 and C1′ show cross-sections as indicated in B. Red arrows indicate delaminating Cas3*pos cells. (D-G) Clone fate categories in CasCREAtlas adults upon injection of CPT (F,F′) versus DMSO (E,E′) at 7 dpi. (D) Experimental scheme. (E,F) Dorsal whole-mount views (right hemisphere, anterior left) processed for IHC for Zo1 (cyan) and Hmg2bmCherry* (red) for the DMSO (E) and CPT (F) treatments. (E′,F′) Segmentation of clones generated within 7 days (at and immediately below the pallial ventricular surface), color-coded [red, NSCs; yellow, parenchymal cells, identified as neurons (of which >87% were single neurons; no neuron doublets are visible on the illustrated fields)]. (G) Clone types at 7 days post-treatment. Graph displays mean±s.e.m. Statistical analysis for global differences between DMSO and CPT-induced CasCreAtlas fates: contingency χ2 test: ****P<0.0001; statistical analyses for individual fates among three possible fates [NSCs (NSC singlets and doublets), delaminating, and neurons only (1N or 2N)]: Fisher's exact test with Bonferroni correction: NSC **P=0.0015; attached: P=3.0; neurons only: **P=0.0018. Four hemipallia per condition. DMSO, n=37 clones; CPT n=89 clones. ns, not significant. Scale bars: 30 µm.

Differential recruitment of atf3pos and Cas3* events under irradiation versus mechanical lesion. (A-D3) Effect of X-rays on NSCs in vivo. (A-B′) γH2AX DNA repair foci (red) in NSCs/NPs (Sox2pos, cyan) revealed by whole-mount IHC on adult pallia under control (A,A′) or irradiation conditions (B,B′) (5 Gy+1 h chase). (C-D3) Casp3* induction (green) in NSCs/NPs (Sox2pos, magenta) revealed by whole-mount IHC on adult pallia under control (C) or irradiation conditions (D) (40 Gy+24 h chase). D1 shows high magnification 3D rendering (Imaris) of the boxed area in D; D2, D2′ and D3 show sections across Cas3* cells as indicated in D. (E-L) Effect of mechanical lesion. (E-J′) atf3 expression detected by chromogenic ISH (F-H: black; I-J′: red) on whole-mount pallia 1 day (G,I,J) or 3 days (H) following stab-wound injury (E) versus uninjured brains (F,I). Dorsal views, anterior left; one hemisphere is shown in I,J. Dashed lines indicate lesion trajectories; open arrowhead indicates downregulated atf3 expression in the contralateral hemisphere at 3 dpl. (J′) High magnification section across an atf3pos cell along the dashed line in J. (K) Proportion of CasCREAtlas clone types in control versus lesioned hemispheres at 7 dpl. Graph displays mean±s.e.m. Statistical analysis for global differences between CasCREAtlas clone types between lesioned and unlesioned hemispheres: contingency χ2 test: ****P<0.0001; statistical analyses for individual fates among three possible fates [NSCs (NSC singlets and doublets), attached clones, and neurogenic clones (delaminating cells, 1N or 2N; this category contains >70% 1N clones in both cases)]: Fisher's exact test with Bonferroni correction: NSC ***P<0.0003; attached: *P=0.023; Delam+N: *P=0.014. Control: 8 hemipallia, n=84 clones; Lesion: 7 hemipallia, 79 clones. (L) Proportion of neurogenic CasCREAtlas clone types in control versus lesioned hemispheres at 7 dpl, distinguishing single versus double neurons. Graph displays mean±s.e.m. Statistical analysis for global differences between single versus double neurons: contingency χ2 test: P=0.669. CTL, control; ns, not significant. Scale bars: 10 µm (A,A′,B,B′); 20 µm (C-C′); 10 µm (D1-D3); 100 µm (F-H); 30 µm (I,J); 10 µm (J′).

Acknowledgments
This image is the copyrighted work of the attributed author or publisher, and ZFIN has permission only to display this image to its users. Additional permissions should be obtained from the applicable author or publisher of the image. Full text @ Development