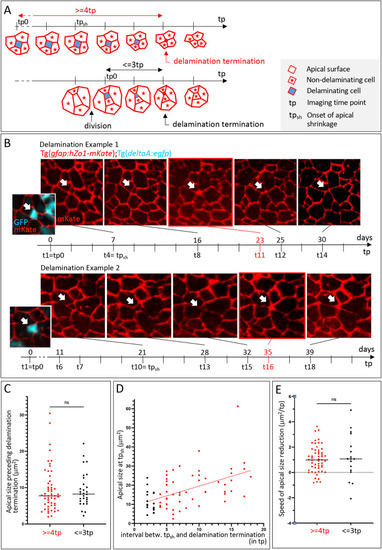
Morphodynamic characterization of delamination events in the adult pallium. (A) Schematics of delamination events observed using intravital imaging in Tg(gfap:Zo1-mKate2) 3 mpf adults (apical views). Horizontal arrows indicate imaging time points (tp); red indicates Zo1; blue indicates the apical surface of a delaminating cell; red stars indicate non-delaminating neighbors. Top: Tracking with ≥4 tp (14-16 days) without visible division prior to delamination termination. tp0, first tp of the movie; tpsh, apical size shrinkage onset. Bottom: Division event taking place ≤3 tp (≤13 days) before delamination termination. tp0, first time point post-division. (B) Snapshots of two delamination events recorded from a Casper;Tg(gfap:hZo1-mKate);Tg(deltaA:egfp) 3 mpf adult (fish Outi; raw data taken from Mancini et al., 2023) (Zo1-mKate channel only, red). White arrows indicate delaminating cells; red frame highlights delamination termination; vertical time ticks indicate imaging tp (bottom) and corresponding days (top). Apical area of cells in examples 1 and 2: 20.1 µm2 and 22.9 µm2, respectively. Insets show images including the deltaA:eGFP channel (cyan) at shrinkage onset. (C-E) Quantified dynamic parameters of delaminations occurring >4 tp without division (red) and ≤3 tp post-division (black). (C) Apical surface area at tp preceding delamination termination. Mann–Whitney test, P=0.661. (D) Apical surface area at tpsh as a function of the duration between tpsh and delamination termination. Linear regression, R2=0.256. (E) Speed of apical size reduction calculated from tpsh until delamination termination. Mann–Whitney test, P=0.849. ns, not significant.
|
