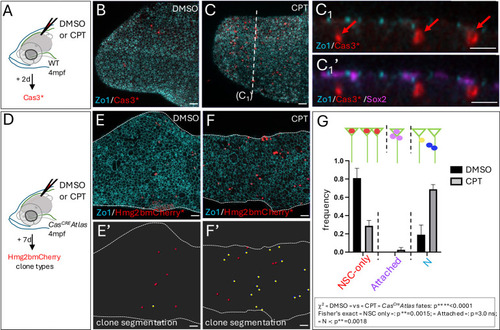
Experimentally induced Cas3* events drive direct neuronal differentiation in the adult pallium. (A-C1′) Induction of Cas3* by CPT (C) versus DMSO (B) injected into the cerebral ventricle (A), revealed by IHC in adult pallia at 2 days post-injection (dpi). (B,C) Dorsal whole-mount views (right hemisphere, anterior left) with IHC for Zo1 (cyan), Cas3* (red) and Sox2 (magenta, only shown in C1′). C1 and C1′ show cross-sections as indicated in B. Red arrows indicate delaminating Cas3*pos cells. (D-G) Clone fate categories in CasCREAtlas adults upon injection of CPT (F,F′) versus DMSO (E,E′) at 7 dpi. (D) Experimental scheme. (E,F) Dorsal whole-mount views (right hemisphere, anterior left) processed for IHC for Zo1 (cyan) and Hmg2bmCherry* (red) for the DMSO (E) and CPT (F) treatments. (E′,F′) Segmentation of clones generated within 7 days (at and immediately below the pallial ventricular surface), color-coded [red, NSCs; yellow, parenchymal cells, identified as neurons (of which >87% were single neurons; no neuron doublets are visible on the illustrated fields)]. (G) Clone types at 7 days post-treatment. Graph displays mean±s.e.m. Statistical analysis for global differences between DMSO and CPT-induced CasCreAtlas fates: contingency χ2 test: ****P<0.0001; statistical analyses for individual fates among three possible fates [NSCs (NSC singlets and doublets), delaminating, and neurons only (1N or 2N)]: Fisher's exact test with Bonferroni correction: NSC **P=0.0015; attached: P=3.0; neurons only: **P=0.0018. Four hemipallia per condition. DMSO, n=37 clones; CPT n=89 clones. ns, not significant. Scale bars: 30 µm.
|
