
- Title
-
Pathogenic proteotoxicity of cryptic splicing is alleviated by ubiquitination and ER-phagy
- Authors
- Prieto-Garcia, C., Matkovic, V., Mosler, T., Li, C., Liang, J., Oo, J.A., Haidle, F., Mačinković, I., Cabrera-Orefice, A., Berkane, R., Giuliani, G., Xu, F., Jacomin, A.C., Tomaskovic, I., Basoglu, M., Hoffmann, M.E., Rathore, R., Cetin, R., Boutguetait, D., Bozkurt, S., Hernández Cañás, M.C., Keller, M., Busam, J., Shah, V.J., Wittig, I., Kaulich, M., Beli, P., Galej, W.P., Ebersberger, I., Wang, L., Münch, C., Stolz, A., Brandes, R.P., Tse, W.K.F., Eimer, S., Stainier, D.Y.R., Legewie, S., Zarnack, K., Müller-McNicoll, M., Dikic, I.
- Source
- Full text @ Science

USP39 deficiency causes RP-like phenotypes and CS. (A) Representative eyes from control zebrafish larvae and usp39 crispants at 104 hours postfertilization (hpf) [retina is indicated by dark blue (control) and light blue (usp39 crispants) arrows] (left) and relative quantification of the retina/eye ratio (right) (n = 8; two-tailed t test; scale bars are 100 μm). (B) Confocal image of representative eyes from control larvae and usp39 crispants treated with acridine orange at 104 hpf (dead cells are indicated by blue arrows) (left) and relative quantification of dead cells in the eyes (right) (n = 8; two-tailed t test; scale bars are 50 μm). (C) Quantification of outer nuclear layer (ONL) thickness in control larvae and usp39 crispants at 104 hpf (n = 5; two-tailed t test). (D) Heat map showing gene expression (z-score) of retinal and photoreceptor genes in usp39 crispants and control larvae (n = 4) at 104 hpf. (E) Quantification of regulated alternative splicing (AS) events (RNA-seq) in si-USP39 HeLa cells (n = 3). (F) Sashimi plot of a representative si-USP39–regulated A5′SS event (n = 3). nt, nucleotides. (G) Percentage of annotated 5′SSs used in si-USP39 and si-Ctrl HeLa cells (n = 3). (H) SS strength for canonical 5′SS and A5′SS of exons with regular 5′SSs (nonregulated) or USP39-regulated 5′SSs (Wilcoxon signed-rank test; n = 3). MaxEnt represents the maximum entropy scores. (I) Kinetic modeling of 5′SS choice in wild-type (WT) and USP39-deficient cells. (J) Kinetic model fit to regulated and non-regulated 5′SS populations in USP39-deficient cells. Shown is the difference in 5′SS use between USP39-deficient and control conditions (ΔPSI) as a function of the percent spliced in (PSI) control; each dot represents the experimental observation for one splicing decision. Data points are colored according to classification into groups reflecting four types of 5′SS regulation by USP39 (regulated or nonregulated for canonical and cryptic 5′SS). The solid lines represent the model fit to all data points of a given group, with a confidence band calculated by bootstrapping (n = 2000). (K) Boxplots showing relative efficiency of U1-U2 bridging interactions, calculated as the ratio of cryptic and canonical efficiency (see methods) inferred by the best-fit models in USP39-deficient HeLa cells (Wilcoxon rank-sum test). Uncertainty was estimated by bootstrapping (n = 2000). For box-and-whisker plots, the center line represents the median, box limits are upper and lower quartiles, and whiskers are minimum and maximum values. PHENOTYPE:
|

The translation of cryptic exons enhances aggregation of misfolded proteins. (A) Quantification of RNA biotypes affected by C5′SSs in si-USP39 HeLa cells (n = 3). lncRNA, long noncoding RNA. (B) Quantification of disrupted, shortened, and elongated C5′SS events affecting RNA coding sequences (CDS) in si-USP39 HeLa cells (n = 3). PTC, premature termination codon. (C) Feature architecture similarity (FAS) assessment identifies misspliced variants where an architecture difference implies a change in protein function. The FAS score ranges from 1 (identical architectures) to 0 (architectures share no features) (colored dots indicate a FAS <0.8; n = 3). (D) Shortened C5′SS BFAR variant with substantial architectural changes based on FAS (top). Red amino acids (aa) are only present in the BFAR canonical isoform owing to CS. At the bottom, Pymol and AlphaFold were used to predict and visualize the 3D structure and electrostatic potential (see also fig. S5B). (E) Translatome showing protein distribution between si-USP39 and si-Ctrl HeLa cells. Proteins with USP39-regulated CS events are shown (dark orange indicates disrupted C5′SS events, light orange indicates elongated C5′SS events, yellow indicates shortened C5′SS events, and light blue indicates other CS events. All genes detected were plotted as control (dark blue) (n = 3). FC, fold change. (F) Heat map representing gene expression (z-score) of heat shock genes for si-USP39 and si-Ctrl HeLa cells (n = 3). (G) Representative silver-staining experiment of input (10% total lysate) and insoluble (misfolded or unfolded) protein fractions in si-Ctrl and si-USP39 HeLa cells (n = 3). (H) TEM images of si-Ctrl and si-USP39 HeLa cells (red arrows indicate protein aggregates) (left; magnified images are shown on the bottom right) and quantification of cells with >5 aggregates in si-Ctrl and si-USP39 HeLa cells (top right) (data are means ± SD; two-tailed t test; si-Ctrl = 210 cells; si-USP39 = 82 cells; scale bars are 1000 nm). The magnified section of si-Ctrl was used as representative ER image in fig. S7F. (I) Proteomic volcano plot of protein aggregates (insoluble fraction) in si-USP39 and si-Ctrl HeLa cells [significantly (p < 0.05) decreased (blue) and significantly increased (green) proteins in si-USP39 cells are shown; red indicates significantly increased protein translated from misspliced transcripts in si-USP39 cells; n = 3]. |

ER accumulation of CSp variants triggers cell death. (A) RNA-seq gene set enrichment analysis of the gene set: Response to ER stress (human gene set Gene Ontology GO:0034976) comparing si-USP39 and si-Ctrl in HeLa and RPE1 cells (n = 3). NES, normalized enrichment score. (B) Immunofluorescence analysis comparing BiP (red) and calreticulin (purple) protein localization and abundance in si-USP39 and si-Ctrl cells (left). BiP abundance is shown in the box plots on the right (n = 50; two-tailed t test; scale bars are 10 μm). DAPI, 4′,6-diamidino-2-phenylindole; RFU, relative fluorescence units. (C) Volcano plots showing ER proteomic fraction for si-USP39 and si-Ctrl cells (red indicates significantly increased protein abundances in proteins translated from misspliced transcripts in si-USP39 cells; n = 3). (D) Immunoblots against phosphorylated IREI (p-IRE1), ATF6, ATF4, and glyceraldehyde phosphate dehydrogenase (GAPDH) in si-USP39 and si-Ctrl cells (left) and a quantification of p-IRE1, ATF4, and cleaved ATF6 in si-Ctrl and si-USP39 HeLa cells (right) (data are means ± SD; two-tailed t test; n = 3). (E) Heat map representing RNA-seq expression (z-score) of representative UPR target genes for ATF6, IRE1, and PERK UPR pathways in si-USP39 and si-Ctrl HeLa cells (n = 3). (F) Immunofluorescence comparing CHOP protein abundance (green) in si-USP39 and si-Ctrl cells (left). A CHOP quantification is shown in the box plots on the right (n = 50; two-tailed t test; scale bars are 10 μm). (G) IncuCyte S3 assay quantifying cytotoxicity (green dye penetrates dead cells). Cytotox green levels after USP39 depletion in control and CHOP KO HeLa cells (data are means ± SD; two-tailed t test; n = 3). (H) Schematic model. CS generates proteotoxic isoforms (misfolded and unfolded proteins), which accumulate in the ER, causing ER-stress, UPR activation, and apoptosis. For box-and-whisker plots, the center line represents the median, box limits are upper and lower quartiles, and whiskers are minimum and maximum values. |

ER-phagy activation alleviates CS-induced ER stress. (A) Macroautophagy flux quantification (IncuCyte S3) using ssRFP-GFP-LC3B in si-USP39 and si-Ctrl cells (data are means; si-Ctrl n = 6; si-USP39 n = 5; two-tailed t test). GFP, green fluorescent protein; RFP, red fluorescent protein. (B) Immunofluorescence against LC3B (green) and LAMP1 (red) in si-USP39 and si-Ctrl HeLa cells (n = 50; scale bars are 5 μm). See also fig. S9D. (C) TEM images of si-Ctrl and si-USP39 HeLa cells exposed to CQ (80 μm for 10 hours) (arrow indicates the ER; n = 10; scale bars are 500 nm). (D) Immunofluorescence images (left) and quantification (right) of puncta in si-Ctrl and si-USP39 PERK(LD)-EGFP-HOTag3 HeLa reporter cells exposed to CQ (100 μM for 10 hours) (red arrows indicate cells without puncta; yellow arrows indicate cells with puncta; the red dashed line in the graph indicates the percentage of cells with puncta for si-Ctrl cells; Fisher’s exact test; si-Ctrl n = 209, si-Ctrl+CQ n = 284, si-USP39 n = 202, and si-USP39+CQ = 249; scale bars are 7 μm). (E) ER-phagy flux quantification (IncuCyte S3) using ssRFP-GFP- KDEL in si-USP39 and si-Ctrl cells (data are means; n = 6; two-tailed t test). (F) LC3B (green) and FAM134B (red) immunofluorescence in si-USP39 and si-Ctrl HeLa cells (arrows indicate FAM134B/LC3B puncta; n = 10; scale bars are 5 μm). See also fig. S9, I and J. (G) Immunoblot against FAM134B and GAPDH in si-USP39 and si-Ctrl cells exposed to CQ (80 μM for 6 hours) (n = 3). (H) Immunoblot (left) and quantification of ubiquitinated FAM134B by tandem ubiquitin binding entities (TUBE) in si-USP39 and si-Ctrl cells (data are means ± SD; n = 3; two-tailed t test). (I) Macroautophagy flux quantification as in (A). Cells were exposed to 80 μM CQ or 250 ng/ml Torin-1 for 24 hours (data are means ± SD; n = 2, but for si-Ctrl and si-USP39, n = 4; two-tailed t test; black p values indicates versus si-Ctrl, and purple p values indicate versus si-USP39). (J) ER-phagy flux quantification as in (E). Cells were exposed to 80 μM CQ or 250 ng/ml Torin-1 for 24 hours (data are means ± SD; n = 2; two-tailed t test; black p values indicate versus si-Ctrl, and purple p values indicate versus si-USP39). (K) BiP immunofluorescence (red) (left) and quantification (right) under the indicated conditions (n = 50, but for si-FAM134B and si-FAM134B+si-USP39, n = 20; two-tailed t test; scale bars are 5 μm). Cells were exposed to CQ (80 μM) for 24 hours. For box-and-whisker plot, the center line represents the median, box limits are upper and lower quartiles, and whiskers are minimum and maximum values. (L) Cell death assay using cytotox green dye under the indicated conditions (data are means ± SD; n = 3; two-tailed t test). Cells were exposed to CQ (low, 40 μM; high, 80 μM), bafilomycin (200 nM/ml), and Torin-1 (250 ng/ml) for 20 hours. |
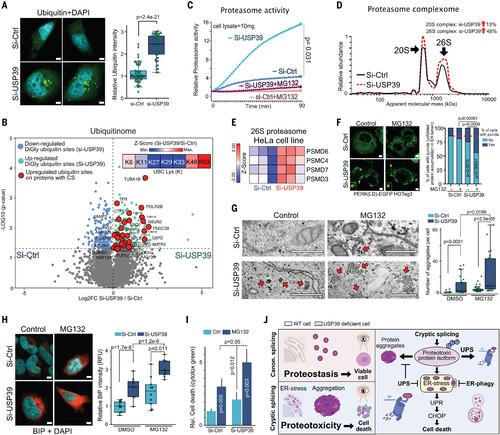
The UPS degrades misspliced isoforms to mitigate proteotoxicity. (A) Ubiquitin (green) immunofluorescence (left) and quantification (right) in si-USP39 and si-Ctrl HeLa cells (n = 50; two-tailed t test; scale bars are 6 μm). (B) Volcano plots representing ubiquitinated diGly sites of si-USP39 and si-Ctrl cells (red indicates significantly more diGly ubiquitin sites in proteins translated from misspliced transcripts in si-USP39 cells). In the right corner, a z-score heat map of K6, K11, K27, K29, K33, K48, and K63 polyubiquitin chain abundances in si-USP39 cells is shown (n = 3). (C) Relative 7-amino-4-methylcoumarin (AMC) levels (proteasome activity) after the incubation of 10 mg of si-USP39 and si-Ctrl cell lysates with 50 μM AMC-Suc-LLVY probe. MG132 was added as a control (data are means ± SD; n = 3; two-tailed t test). (D) Relative protein abundance of 20S and 26S proteasome complexes in si-Ctrl and si-USP39 HeLa cells from fig. S11A. (E) Heat map representing gene expression (z-score) of representative 26S proteasome genes in si-USP39 and si-Ctrl HeLa cells (n = 3). (F) Immunofluorescence (left) and quantification (right) of puncta in si-Ctrl and si-USP39 PERK(LD)-EGFP-HOTag3 HeLa reporter cells exposed to MG132 (10 μM) for 10 hours (si-Ctrl n = 203, si-Ctrl+MG132 n = 188, si-USP39 n = 186, and si-USP39+MG132 n = 181; Fisher’s exact test calculator; yellow arrows mark the puncta of representative cells that have puncta; scale bars are 3 μm). The red dashed line indicates the percentage of cells with puncta for si-Ctrl cells. (G) TEM images (left) and quantification (right) of aggregates of si-Ctrl and si-USP39 HeLa cells exposed to MG132 (10 μM for 8 hours) si-Ctrl n = 31, si-USP39 n = 24, si-ctrl+MG132 n = 41, and si-USP39+MG132 n = 26; two-tailed t test; arrows indicate aggregates; scale bars are 500 nm) (H) BiP immunofluorescence (red) (left) and quantification (right) in si-Ctrl and si-USP39 MG132 HeLa cells exposed to BiP (10 μM for 8 hours) (n = 10; two-tailed t test; scale bars are 5 μm). DMSO, dimethyl sulfoxide. (I) Cell death assay using cytotox green dye in si-Ctrl and si-USP39 HeLa cells (data are means ± SD; n = 3; two-tailed t test) exposed to MG132 (10 μM) for 20 hours. (J) Schematic model summarizing our findings. CS triggers proteotoxicity but is mitigated by UPS and ER-phagy. For box-and-whisker plots, the center line represents the median, box limits are upper and lower quartiles, and whiskers are minimum and maximum values. [Panel (J) created in part with BioRender.com] |

ZFIN is incorporating published figure images and captions as part of an ongoing project. Figures from some publications have not yet been curated, or are not available for display because of copyright restrictions. PHENOTYPE:
|