
|
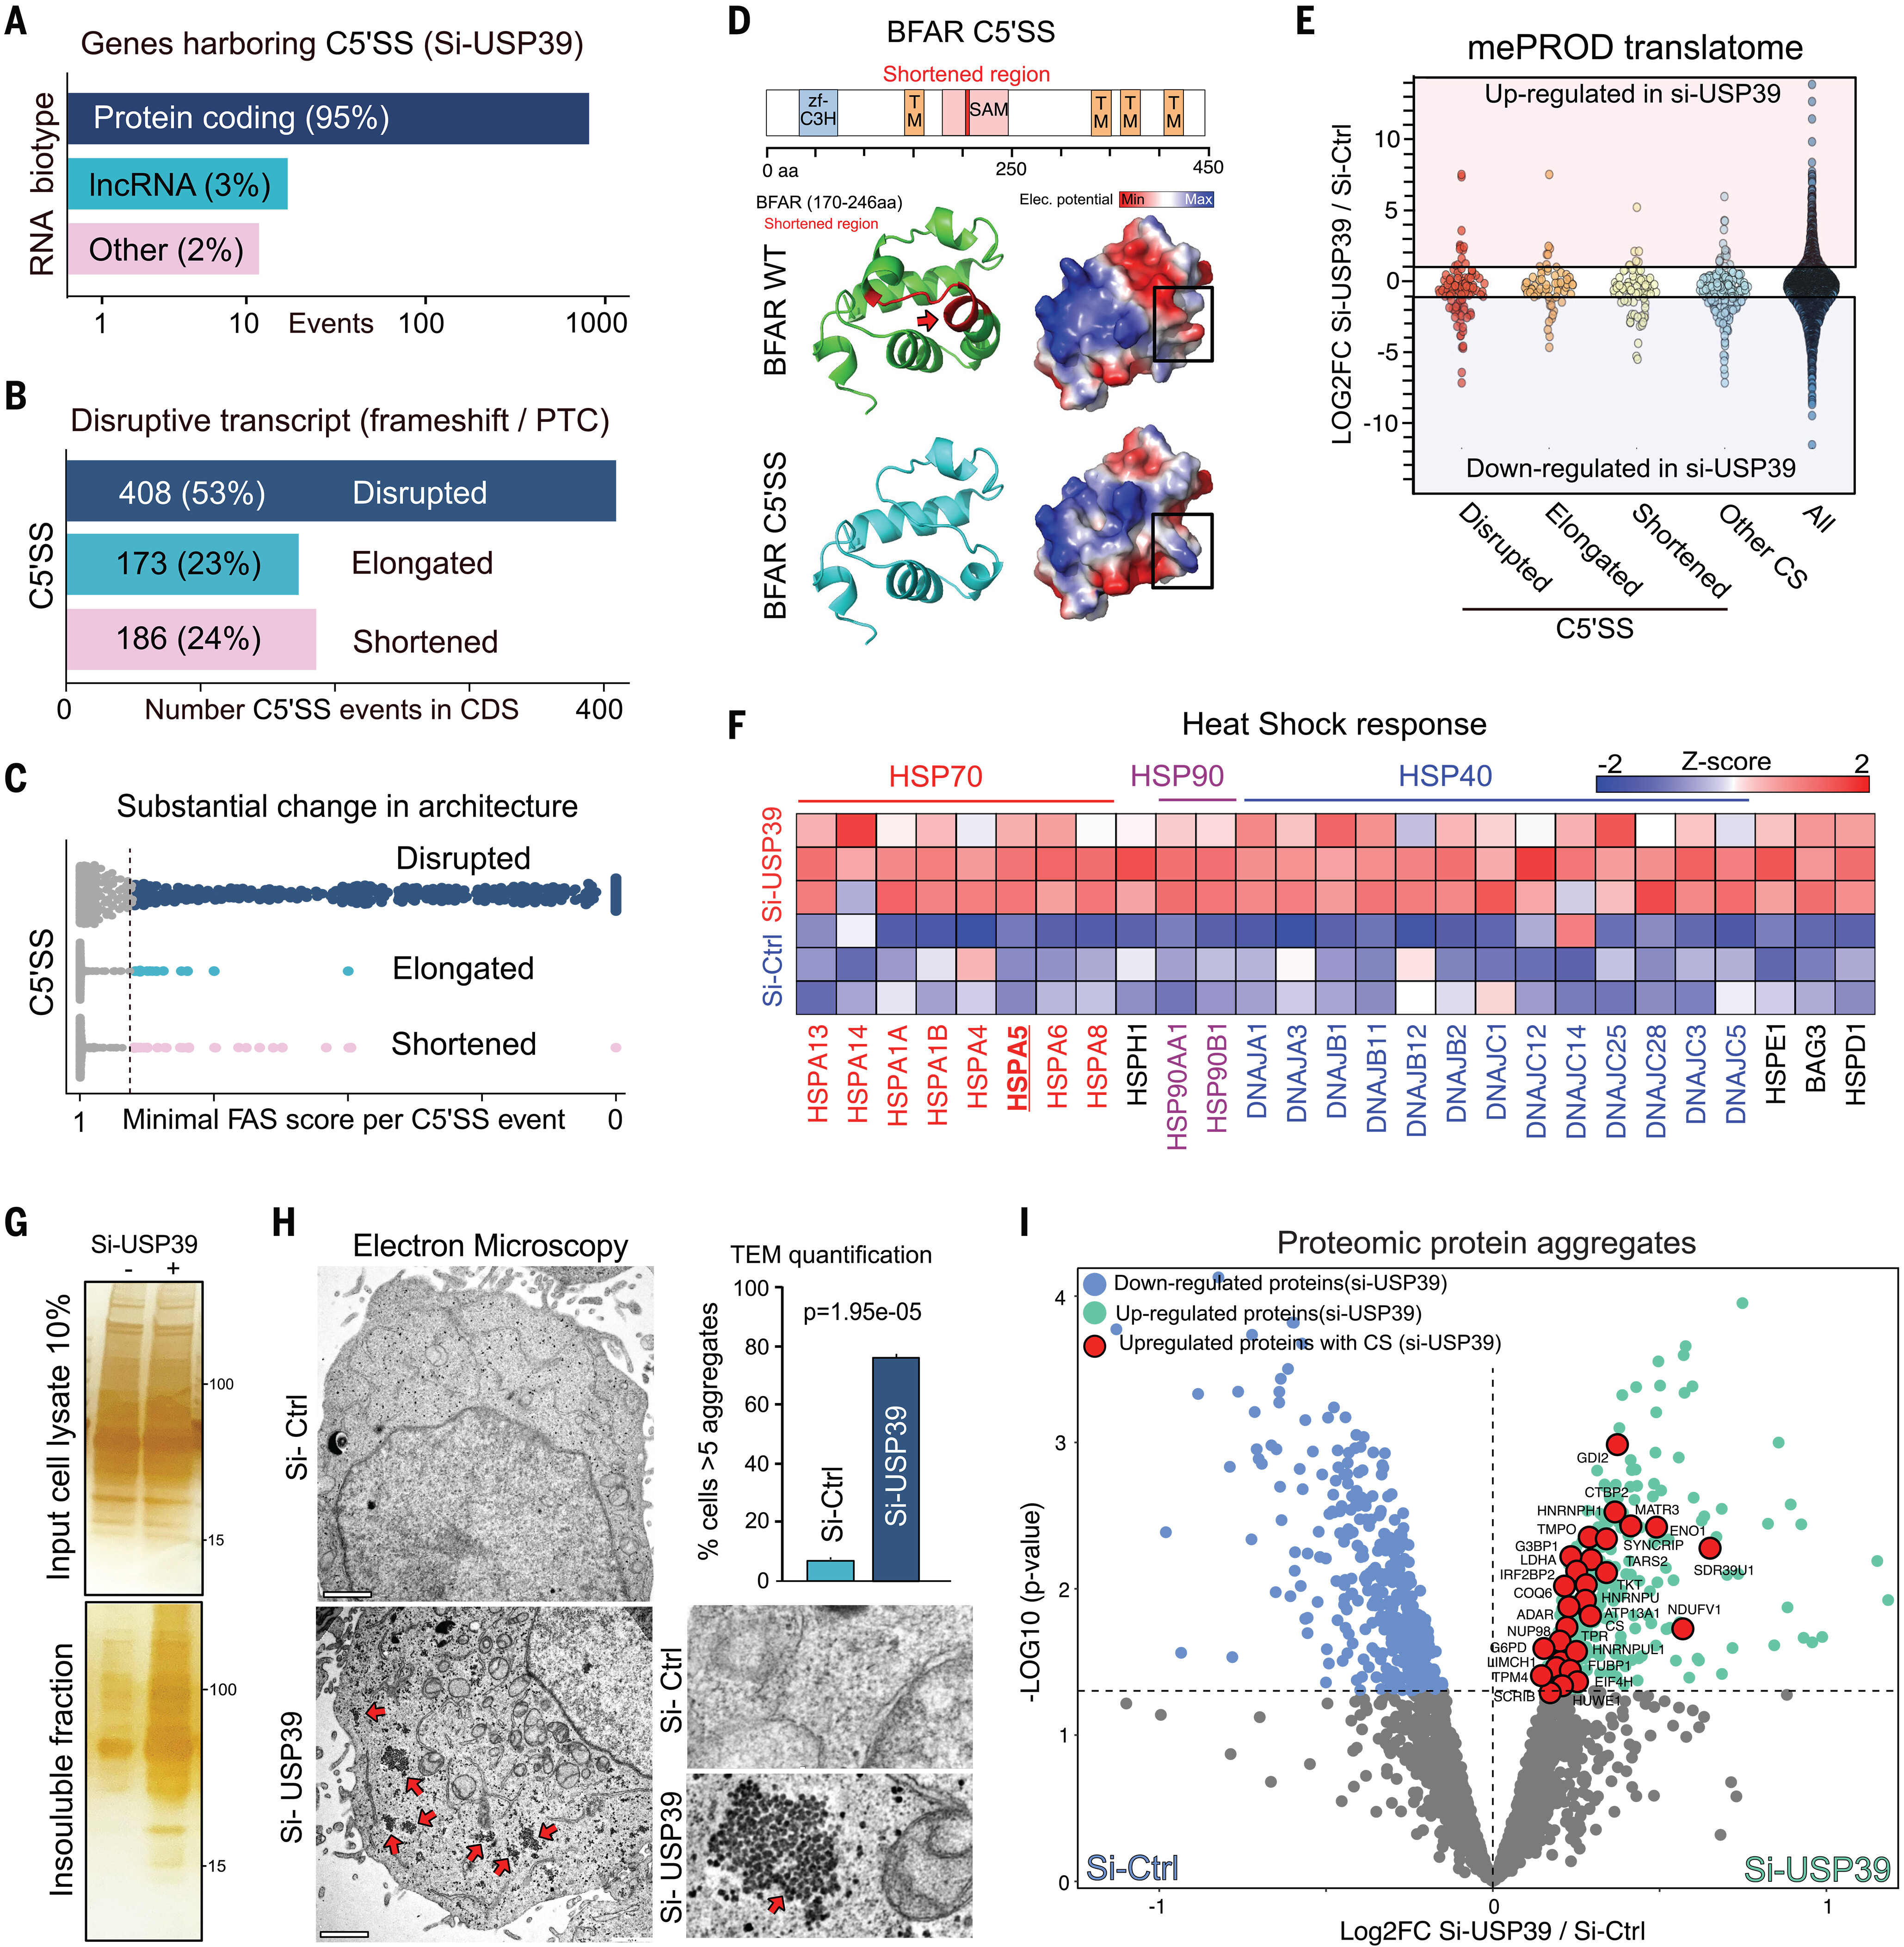
Fig. 2 The translation of cryptic exons enhances aggregation of misfolded proteins. (A) Quantification of RNA biotypes affected by C5′SSs in si-USP39 HeLa cells (n = 3). lncRNA, long noncoding RNA. (B) Quantification of disrupted, shortened, and elongated C5′SS events affecting RNA coding sequences (CDS) in si-USP39 HeLa cells (n = 3). PTC, premature termination codon. (C) Feature architecture similarity (FAS) assessment identifies misspliced variants where an architecture difference implies a change in protein function. The FAS score ranges from 1 (identical architectures) to 0 (architectures share no features) (colored dots indicate a FAS <0.8; n = 3). (D) Shortened C5′SS BFAR variant with substantial architectural changes based on FAS (top). Red amino acids (aa) are only present in the BFAR canonical isoform owing to CS. At the bottom, Pymol and AlphaFold were used to predict and visualize the 3D structure and electrostatic potential (see also fig. S5B). (E) Translatome showing protein distribution between si-USP39 and si-Ctrl HeLa cells. Proteins with USP39-regulated CS events are shown (dark orange indicates disrupted C5′SS events, light orange indicates elongated C5′SS events, yellow indicates shortened C5′SS events, and light blue indicates other CS events. All genes detected were plotted as control (dark blue) (n = 3). FC, fold change. (F) Heat map representing gene expression (z-score) of heat shock genes for si-USP39 and si-Ctrl HeLa cells (n = 3). (G) Representative silver-staining experiment of input (10% total lysate) and insoluble (misfolded or unfolded) protein fractions in si-Ctrl and si-USP39 HeLa cells (n = 3). (H) TEM images of si-Ctrl and si-USP39 HeLa cells (red arrows indicate protein aggregates) (left; magnified images are shown on the bottom right) and quantification of cells with >5 aggregates in si-Ctrl and si-USP39 HeLa cells (top right) (data are means ± SD; two-tailed t test; si-Ctrl = 210 cells; si-USP39 = 82 cells; scale bars are 1000 nm). The magnified section of si-Ctrl was used as representative ER image in fig. S7F. (I) Proteomic volcano plot of protein aggregates (insoluble fraction) in si-USP39 and si-Ctrl HeLa cells [significantly (p < 0.05) decreased (blue) and significantly increased (green) proteins in si-USP39 cells are shown; red indicates significantly increased protein translated from misspliced transcripts in si-USP39 cells; n = 3].