
Fig. 5
- ID
- ZDB-FIG-241210-59
- Publication
- Prieto-Garcia et al., 2024 - Pathogenic proteotoxicity of cryptic splicing is alleviated by ubiquitination and ER-phagy
- Other Figures
- All Figure Page
- Back to All Figure Page
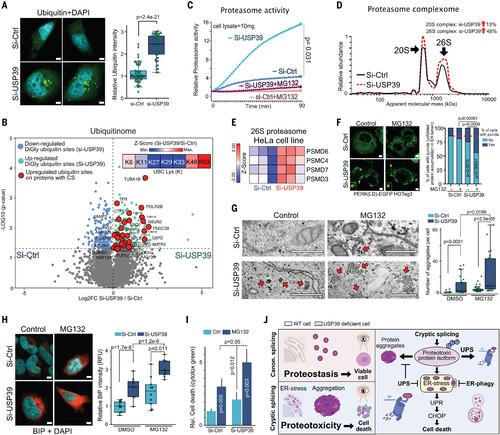
The UPS degrades misspliced isoforms to mitigate proteotoxicity. (A) Ubiquitin (green) immunofluorescence (left) and quantification (right) in si-USP39 and si-Ctrl HeLa cells (n = 50; two-tailed t test; scale bars are 6 μm). (B) Volcano plots representing ubiquitinated diGly sites of si-USP39 and si-Ctrl cells (red indicates significantly more diGly ubiquitin sites in proteins translated from misspliced transcripts in si-USP39 cells). In the right corner, a z-score heat map of K6, K11, K27, K29, K33, K48, and K63 polyubiquitin chain abundances in si-USP39 cells is shown (n = 3). (C) Relative 7-amino-4-methylcoumarin (AMC) levels (proteasome activity) after the incubation of 10 mg of si-USP39 and si-Ctrl cell lysates with 50 μM AMC-Suc-LLVY probe. MG132 was added as a control (data are means ± SD; n = 3; two-tailed t test). (D) Relative protein abundance of 20S and 26S proteasome complexes in si-Ctrl and si-USP39 HeLa cells from fig. S11A. (E) Heat map representing gene expression (z-score) of representative 26S proteasome genes in si-USP39 and si-Ctrl HeLa cells (n = 3). (F) Immunofluorescence (left) and quantification (right) of puncta in si-Ctrl and si-USP39 PERK(LD)-EGFP-HOTag3 HeLa reporter cells exposed to MG132 (10 μM) for 10 hours (si-Ctrl n = 203, si-Ctrl+MG132 n = 188, si-USP39 n = 186, and si-USP39+MG132 n = 181; Fisher’s exact test calculator; yellow arrows mark the puncta of representative cells that have puncta; scale bars are 3 μm). The red dashed line indicates the percentage of cells with puncta for si-Ctrl cells. (G) TEM images (left) and quantification (right) of aggregates of si-Ctrl and si-USP39 HeLa cells exposed to MG132 (10 μM for 8 hours) si-Ctrl n = 31, si-USP39 n = 24, si-ctrl+MG132 n = 41, and si-USP39+MG132 n = 26; two-tailed t test; arrows indicate aggregates; scale bars are 500 nm) (H) BiP immunofluorescence (red) (left) and quantification (right) in si-Ctrl and si-USP39 MG132 HeLa cells exposed to BiP (10 μM for 8 hours) (n = 10; two-tailed t test; scale bars are 5 μm). DMSO, dimethyl sulfoxide. (I) Cell death assay using cytotox green dye in si-Ctrl and si-USP39 HeLa cells (data are means ± SD; n = 3; two-tailed t test) exposed to MG132 (10 μM) for 20 hours. (J) Schematic model summarizing our findings. CS triggers proteotoxicity but is mitigated by UPS and ER-phagy. For box-and-whisker plots, the center line represents the median, box limits are upper and lower quartiles, and whiskers are minimum and maximum values. [Panel (J) created in part with BioRender.com] |