
- Title
-
PEPITA: Parallelized High-Throughput Quantification of Ototoxicity and Otoprotection in Zebrafish Larvae
- Authors
- Nilles, E.M., Bustad, E., Qin, M., Mudrock, E., Gu, A., Galitan, L., Ou, H.C., Hernandez, R.E., Ma, S.
- Source
- Full text @ Bio Protoc

Procedure for adhering the nylon mesh to the 3D-printed multi-well plate insert. (A) Place the 3D-printed insert on top of nylon mesh and aluminum foil. (B) Firmly press the 3D-printed insert onto the mesh for 3 s. (C) Press around the perimeter of each well to form a complete seal around the base of the well with the nylon mesh. |
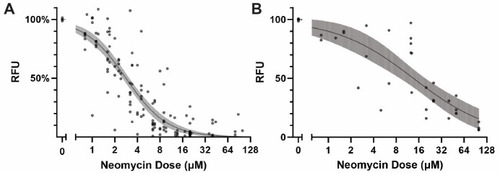
Overview of the variability in neomycin dose-response curves obtained by PEPITA. (A) YO-PRO-1-stained AB fish (27 experiments). (B) myo6b::gfp fish (7 experiments). Each point represents a different condition measured in a different experiment. The line and shaded area indicate the log-logistic curve and 95% confidence interval of the estimated dose-response. |

Neomycin dose response in YO-PRO-1-stained AB fish. (A) Top: Representative neomycin dose-response curve generated by PEPITA with relative fluorescence units (RFU) (EC50 = 1.4 μM). Middle and bottom: Representative image of a fish exposed to no drug (middle) and exposed to 2.5 μM neomycin (bottom), both used for PEPITA quantification. (B) Top: representative neomycin dose-response curve generated by standard approach of counting HCs from individual neuromasts (EC50 = 2.0 μM). Middle and bottom: Representative image of an individual neuromast from a fish exposed to no drug (middle) and exposed to 2.5 μM neomycin (bottom), used for HC counting. Note that PEPITA uses whole-fish images for quantification; images have been cropped for better visualization of the stained neuromasts. Scale bars: fish images = 300 μm; neuromast images = 10 μm. |
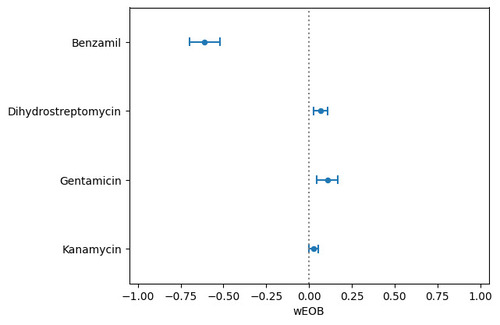
Drug interaction scores [represented as windowed excess over Bliss (wEOB), x-axis] between neomycin and other drugs screened for ototoxic drug interactions, indicated in y-axis. wEOB is calculated for each well exposed to both drugs using a similar equation as excess over bliss (EOB) metric [11], with the formula EOB = Ra × Rb -Rab , where Ra and Rb are the responses of the individual drug dose exposures, and Rab is the response of the combined drug dose exposure. Wells with expected and observed responses outside 10%–90% were excluded from the aggregated calculation of the score across dose combinations for a particular drug pair, and the remaining data were averaged to yield the composite wEOB interaction score, intended to represent the overall trend of interaction between two drugs across a range of dose combinations. |

Example of improper and proper view of larvae in the 96-well imaging plate. (A) Halo ring effect obscuring view of larva. The volume of water in this well is inappropriate, resulting in a shadow cast toward the inside of the well that hinders the view of the fish. (B) Clear image of the zebrafish. Using an appropriate volume of water in the well results in a clear, unobstructed view of the larva. |