
Image
|
Figure Caption
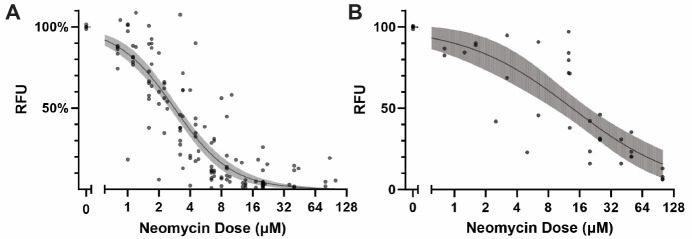
Fig. 2 Overview of the variability in neomycin dose-response curves obtained by PEPITA. (A) YO-PRO-1-stained AB fish (27 experiments). (B) myo6b::gfp fish (7 experiments). Each point represents a different condition measured in a different experiment. The line and shaded area indicate the log-logistic curve and 95% confidence interval of the estimated dose-response.
Acknowledgments
This image is the copyrighted work of the attributed author or publisher, and
ZFIN has permission only to display this image to its users.
Additional permissions should be obtained from the applicable author or publisher of the image.
Full text @ Bio Protoc