FIGURE SUMMARY
Title

Human ITGAV variants are associated with immune dysregulation, brain abnormalities, and colitis

Authors
Ghasempour, S., Warner, N., Guan, R., Rodari, M.M., Ivanochko, D., Whittaker Hawkins, R., Marwaha, A., Nowak, J.K., Liang, Y., Mulder, D.J., Stallard, L., Li, M., Yu, D.D., Pluthero, F.G., Batura, V., Zhao, M., Siddiqui, I., Upton, J.E.M., Hulst, J.M., Kahr, W.H.A., Mendoza-Londono, R., Charbit-Henrion, F., Hoefsloot, L.H., Khiat, A., Moreira, D., Trindade, E., Espinheira, M.D.C., Pinto Pais, I., Weerts, M.J.A., Douben, H., Kotlarz, D., Snapper, S.B., Klein, C., Dowling, J.J., Julien, J.P., Joosten, M., Cerf-Bensussan, N., Freeman, S.A., Parlato, M., van Ham, T.J., Muise, A.M.
Source
Full text @ J. Exp. Med.

Clinical features. (A and B) Brain MRI (A) and colonoscopy (B) of P1. (C) Gross image showing colectomy specimen from P1 with diffuse pancolitis. (D) H&E stains, left (10× magnification), showing full thickness section of the distal colon with inflammation limited to the superficial submucosa and inflammatory pseudopolyps with lymphoid aggregates (arrows). The uninflamed muscularis propria and subserosa with congested vessels can be seen. (D) Center and right (200× magnification), showing lamina propria with numerous neutrophils and eosinophils accompanying two multinucleated giant cells, indicating a site of crypt rupture. (E) Colonoscopy of P2. (F) Image of P2 showing severe atopic dermatitis. (G) Screening for IgE against 295 allergens with the ALEX Allergy Explorer. (H) Eosinophil counts in whole blood (n = 7), normal upper limit <0.5 × 10⁹/liter; and IgE concentrations (n = 4), normal upper limit (IgE < 100 kU/liter) for P2 (red dots).

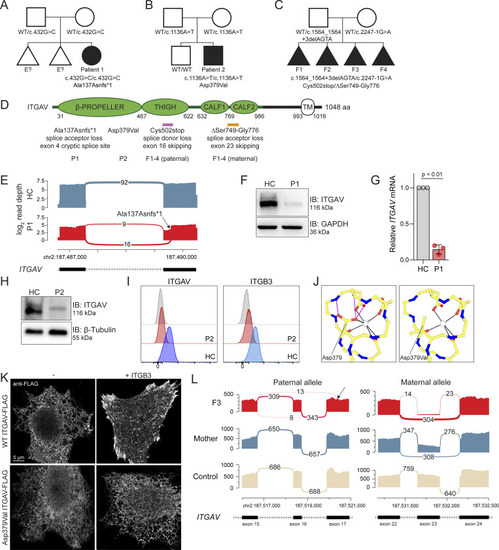
Genetic and functional significance of ITGAV variants. (A–C) Pedigrees of (A) Family 1, (B) Family 2, and (C) Family 3. Symbols: unknown genotype, ‘‘E?’’; fetus, triangle. (D) Cartoon of Integrin αV protein domain structure demonstrating protein-coding and splicing defects. TM, transmembrane. (E) Sashimi plots of RNA sequencing from fibroblasts demonstrating the novel splice acceptor site in ITGAV exon 4 of P1 (red tracks) compared with healthy control (HC, blue tracks). y axis: number of reads in log2 scale; x axis: genomic location. Only the canonical transcript model and junctions with ≥5 reads are shown. (F and G) Immunoblotting of Integrin αV protein level (n = 3) (F) and ITGAV mRNA by qPCR in fibroblasts derived from an HC or P1 (G). GAPDH was used as a loading control. qPCR was normalized to GAPDH, normalized to HC fibroblasts. (n = 3, paired t test, P < 0.01, error bars, mean ± SEM). (H and I) Immunoblotting (n = 3) (H) and Flow cytometry (I) of Integrin αV and Integrin β3 surface expression in lymphoblastoid cell lines derived from HC and P2 (n = 3). (J) Ca2+ ion (depicted as a white circle) coordination by the Asp379 Integrin αV sidechain mutated in P2, as well as the sidechains of Asp381, Asp383, and Asp387, are shown (black dashes). Stabilizing hydrogen bonds between backbone atoms and the Integrin αV Asp379 sidechain are also shown (magenta dashes). Models generated from PDB: 4G1M. (K) Spinning disc confocal microscopy of Integrin αV-FLAG alone (left) or co-expressed with Integrin β3 (right) in HeLa cells (n = 3). (L) Sashimi plots of RNA-sequencing data showing alternative ITGAV splicing of exon 16 (left) and exon 23 (right) in the mother (blue tracks), F3 (red tracks), and unrelated control (light yellow tracks). Left panel also indicates skipping and a novel cryptic acceptor site in exon17 in ITGAV (arrow). y axis: number of reads. x axis: genomic location. Only the canonical transcript model and junctions with ≥5 reads are shown. Source data are available for this figure: SourceData F2.

ITGAV variants cause defects in TGF-β signaling and gene expression. (A) Volcano plot of differentially expressed genes between P1 and HC derived fibroblasts (n = 3, adjusted P value <1e−10, DESeq2 Wald) (left). A subset of genes related to TGF-β signaling obtained from Harmonizome 3.0 (right). (B) Volcano plot of overall differentially expressed genes between P1 and a HC derived lymphoblastoid cell line (n = 3 replicates per sample, adjusted P value <1e−10, DESeq2 Wald test) (left). P1 lymphoblasts show loss of ITGAV transcript and upregulation of some immune regulatory genes. A subset of genes related to TGF-β signaling (right). (C–F) Fibroblasts from P1 or HC immunostained for Integrin αV (magenta) and vinculin (cyan) together with phalloidin (yellow) for F-Actin. In D–F, each dot represents a field of view (paired t test, P < 0.0001, ns, ns, n = 3). (G and H) Immunoblotting for pSMAD3 (Ser 423/425), SMAD3, and Integrin αV protein levels in fibroblasts derived from HC or P1 as indicated before and after 20 ng/ml mature TGF-β stimulation for 15 min (n = 3). GAPDH was used as a loading control. Values were normalized to HC (paired t test, P < 0.05, error bars, mean ± SEM). (I and J) Immunohistochemistry staining for SMAD3 in biopsies of the ascending colon obtained from an IBD control patient and P1. Slides were also stained with H&E. Sections were quantified using thresholding of signal in the nucleus by HALO. Three independent sections of the same gut were analyzed (paired t test, P < 0.01, n = 3). Source data are available for this figure: SourceData F3.

Zebrafish: Early microglia phenotype. (A) Brightfield images of wt and itgav−/− zebrafish at 5 dpf demonstrating intracranial hemorrhage, swollen hearts, and gut abnormalities in the knockouts (arrowheads). (B) Volcano plots of differentially expressed transcripts in 8 dpf itgav−/− compared with wt whole zebrafish, annotated on GRCz11 (left). (n = 3, adjusted P value 0.05, DESeq2 Wald). A subset of genes related to TGF-β signaling (right). (C) Heatmap of the top 30 unbiased differentially expressed genes in 8 dpf itgav−/− larvae (n = 3). (D–F) Representative images of the eye vessels of itgav−/−;Tg(flk1:EGFP) and wt;Tg(flk1:EGFP) zebrafish larvae at 6 dpf. Confocal images of intraocular vasculature network (lateral view) of the whole mount. The intensity of EGFP of the intraocular vasculature (E) and the number of vessels branching in the intraocular vasculature network were quantified (F) (n = 4 zebrafish per group, t test, P < 0.01, P < 0.05, error bars mean ± SEM). (G and H) Representative images of zebrafish larvae microglia (arrowheads) stained with neutral red. Dorsal view (right) and lateral view (left) of wt and itgav−/− zebrafish microglia at 6 dpf. Quantification of microglia numbers is shown on the right. (n = 16, unpaired t test, P < 0.0001, mean).

Zebrafish: Late colitis phenotype. (A) Representative image of wild-type (wt) and itgav−/− zebrafish at 50 dpf. (B) Kaplan–Meier survival curve of zebrafish wt and itgav−/− (n = 20, log-rank Mantel–Cox test, P < 0.05) (C and D) Measurements of body weight (C) and body length (D) (n = 12, unpaired t test, P < 0.0001). (E) Representative images of H&E staining of cross sections corresponding to the mid-intestine of zebrafish at 50 dpf (n = 3). (F) Total enterocolitis score of the gut for zebrafish wt and itgav−/− (n = 3, unpaired t test, P < 0.001). (G) Representative images of villin1 (green) and DAPI (nuclei, blue) imaged with immunofluorescence in the mid-intestine of wt and itgav−/− zebrafish at 50 dpf (n = 3). (H) Volcano plot of RNA-sequencing data showing differential gene expression between 50 dpf itgav−/− versus wt fish dissected gut tissue, annotated on GRCz11 (left). Subset of differentially expressed inflammatory cytokine genes in the gut at 50 dpf (right) (n = 3, adjusted P value 0.01, DESeq2 Wald). (I and J) Representative images of total smad3 and p-smad3 (green) and DAPI (nuclei, blue) imaged with immunofluorescence in the mid-intestine of wt and itgav−/− zebrafish at 50 dpf (n = 3). (K and L) Quantification of total smad3 and p-smad3 in the muscle layer and enterocytes for the mid-intestine of wt and itgav−/− zebrafish at 50 dpf (10 intestinal folds from unpaired t test, n = 3 for each group).

Biophysical properties of recombinant ITGAV and additional RNA sequencing. (A) Representative BLI curves of WT and W144C proteins binding to biotinylated TGF-β3 peptide. KD, kon, and koff, are the equilibrium dissociation constant, on rate, and off rate, respectively. Values are indicated along with standard error; n = 3. (B) CD melting curves were observed at 218 nm for WT and W144C proteins. Dotted lines at the inflection point indicate melting temperature (Tm). (C) Sashimi plots showing the novel splicing site in ITGAV exon 4 (only junctions with ≥5 reads are shown), generated by ggsashimi. A blue * indicates the canonical splice acceptor site while a black arrow marks the novel splice site in exon 4. Three replicates are shown using a lymphoblast cell lines derived from P1 (top) and an unrelated healthy control (WT, bottom). y axis: number of reads. x axis: genomic location. Only the canonical transcript model is shown. (D) Cartoon demonstrating the abnormal splicing junction that occurs between exons 3 and 4 of ITGAV, visualized using GenomeBrowse, because of the c.432G > C variant identified in P1. ITGAV amino acid numbering is shown for the indicated two transcript IDs. The canonical splice acceptor site is highlighted using a blue box while the novel splice acceptor site is shown using a black box. The position of the variant in P1 is marked by an arrow. The new reading frame of the novel splice site gives rise to a premature stop codon. (E) Volcano plot showing differentially expressed genes from RNA-sequencing data comparing fetus (F3) derived fibroblasts versus 100 controls. x axis: z-score. y axis: −log10fold. (F) Structural modeling of inframe deletions identified in Family 3. The 27 amino acid in-frame deletion of residues S750 to G776 spanning the CALF1 and CALF2 domains (indicated in orange) would (i) invert the CALF1 domain resulting in (ii) the misalignment of the alpha and beta chains. The 44 amino acid in-frame deletion of residues F503 to S546 within the THIGH domain (iii) would ablate an (iv) electronegative loop interacting with an electropositive pocket on the alpha chain. Models generated from PDB: 4G1M.

Molecular characterization of the zebrafish itgav gene and generation of itgav knockout mutant. (A) The zebrafish itgav gene: The genomic structure of the zebrafish itgav gene, comprising 30 exons, is depicted. (B)itgav−/− mutant generation: CRISPR/Cas9 genome editing was employed to generate an itgav−/− mutant. The guide RNA targeted exon 4 just before the conserved tryptophan, resulting in a 3-bp deletion and an early stop codon. (C) Molecular validation: HRM analysis corroborated the deletion, and real-time PCR demonstrated downregulation of itgav mRNA, suggesting nonsense-mediated RNA decay.

Acknowledgments
This image is the copyrighted work of the attributed author or publisher, and ZFIN has permission only to display this image to its users. Additional permissions should be obtained from the applicable author or publisher of the image. Full text @ J. Exp. Med.