
Figure 4.
- ID
- ZDB-IMAGE-241115-92
- Publication
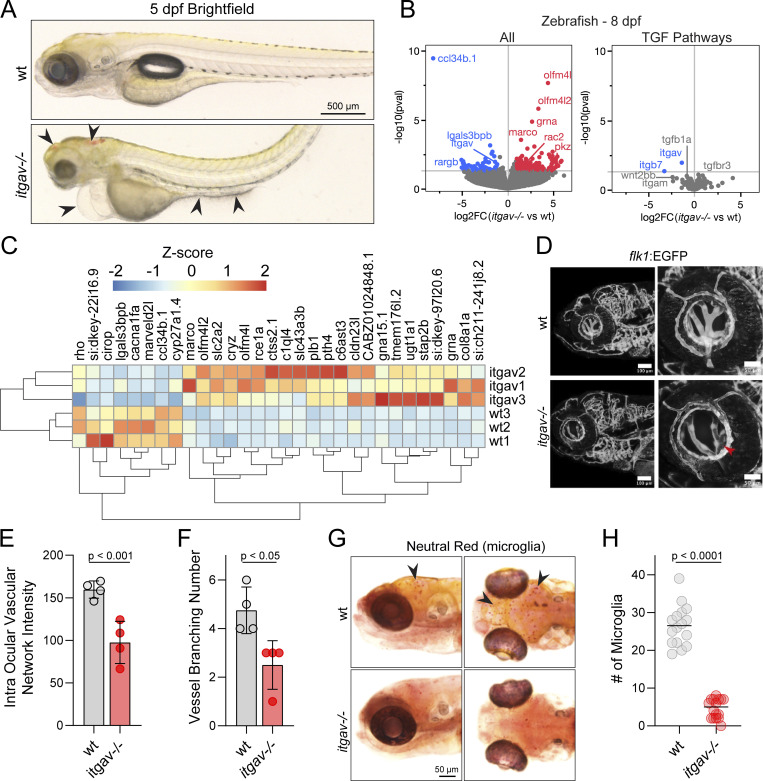
- Ghasempour et al., 2024 - Human ITGAV variants are associated with immune dysregulation, brain abnormalities, and colitis
- All Figures
- Figures for Ghasempour et al., 2024
|
Figure 4.