Identification of major pituitary cell types in wild-type and gnrh3−/− sexually mature female zebrafish pituitary. (A) Schematic presentation of single-cell RNA sequencing workflow. (B) UMAP representation of molecularly defined distinct cell types in the pituitaries. (C) UMAP representation of pituitary cell types by genotype. (D) Dot plot classifying pituitary cell types by known marker gene expression. The color and size of the dots represent the z-scaled average gene expression level and the proportion of cells expressing the gene, respectively.

Abbreviation: UMAP, uniform manifold.

Molecular factors potentially regulating LH and FSH secretion in zebrafish females. Heatmaps of z-scaled expression centered at 0 for individual comparisons between cell types for genes encoding (A) receptors, (B) peptides, and (C) transcription factors.
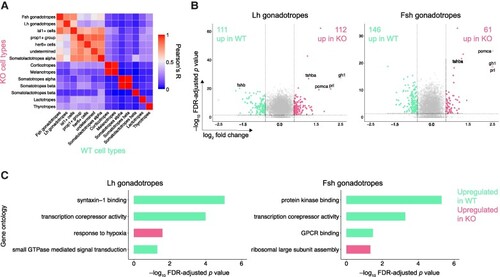
Major differences between WT and gnrh3−/− pituitaries. (A) Heatmap illustrating Pearson's correlations in gene expression between the WT and gnrh3−/− cell types. (B) Volcano plots representing differentially expressed genes, DEGs, defined by P < .05 and fold change > 1.5 in the gnrh3−/− LH gonadotropes (left) and FSH gonadotropes (right) vs those of the WT pituitary sample. (C) Bar plots representing significant enrichment of DEGs in specific Gene Ontology categories. ***P < .001.

Abbreviations: DEG, identified differentially expressed gene; WT, wild-type.

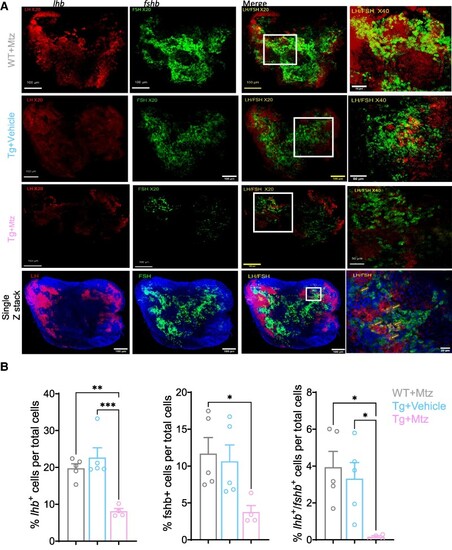
Depletion of GnRH3 neurons leads to reduced gonadotropes number in mature female pituitaries. WT females and Tg(gnrh3:Gal4ff; UAS:nfsb-mCherry) treated with either vehicle or Mtz for 14 days. Pituitaries were subjected to double labeling in situ hybridization followed by cell counting. (A) Pituitary of representative WT with Mtz (upper panel), Tg with vehicle (second panel from top), and Tg with Mtz (third panel from top) treated females. Fourth panel depicts a single 20 µm Z-stack image of WT pituitary stained with Hoechst 3342. From left to right: lhb mRNA (red), fshb mRNA (green), merged image to analyze colocalization of lhb and fshb, and a magnification of the rectangular area depicting region. (B) Percentage of lhb+, fshb+, and lhb+/fshb+ colocalized cells in the proximal pars distalis (PPD) counted in the photographed pituitaries (WT-Mtz and Tg-Cont, n = 5, Tg-Mtz, n = 4). Results are presented as mean ± SEM. Statistical significances were tested by one-way ANOVA followed by Tukey multiple comparison test. *P < .05, **P < .01, ***P < .001, ****P < .0001.

Abbreviations: Mtz, metronidazole; Cont, control; WT, wild-type; Tg, transgenic.

Proposed functional regulatory pathways of LH and FSH gonadotropes in adult female zebrafish. Gnrh3 directly acts on LH gonadotropes through Gnrhr2 to regulate gene expression of various non-Lhb hormone encoding genes, including fshb, by that contributing to LH-gonadotrope specialization. Alternatively, the upregulation of the nonprimary hormones in LH gonadotropes occurs during the preparation of the cells for single-cell RNA sequencing and is denoted by the question mark next to gene expression. The estrogenic pathway seems prominent in LH gonadotrope and manifested via 3 different estrogen nuclear receptors that facilitate LH synthesis and secretion. The expression of the receptors galr1b and cckrb, but not Gnrhr, in FSH gonadotropes infers a non-GnRH regulation of FSH synthesis and secretion. The estrogenic pathway is less prominent in FSH gonadotropes and is executed only via 1 nuclear receptor, Esr1.

Acknowledgments
This image is the copyrighted work of the attributed author or publisher, and ZFIN has permission only to display this image to its users. Additional permissions should be obtained from the applicable author or publisher of the image. Full text @ Endocrinology