
FIGURE
Figure 3.
- ID
- ZDB-FIG-241119-96
- Publication
- Tanaka et al., 2024 - Gonadotropin releasing hormone - gonadotropes interactions revealed by pituitary single-cell transcriptomics in zebrafish
- Other Figures
- All Figure Page
- Back to All Figure Page
Figure 3.
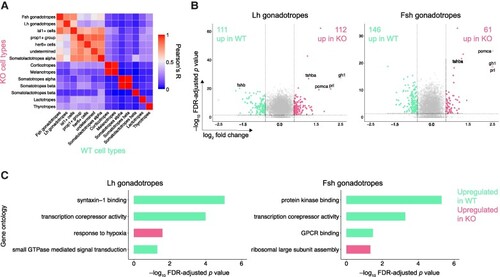
Major differences between WT and Abbreviations: DEG, identified differentially expressed gene; WT, wild-type. |
Expression Data
Expression Detail
Antibody Labeling
Phenotype Data
Phenotype Detail
Acknowledgments
This image is the copyrighted work of the attributed author or publisher, and
ZFIN has permission only to display this image to its users.
Additional permissions should be obtained from the applicable author or publisher of the image.
Full text @ Endocrinology