
- Title
-
Pharmacological Inhibition of the Spliceosome SF3b Complex by Pladienolide-B Elicits Craniofacial Developmental Defects in Mouse and Zebrafish
- Authors
- Hoshino, Y., Liu, S., Furutera, T., Yamada, T., Koyabu, D., Nukada, Y., Miyazawa, M., Yoda, T., Ichimura, K., Iseki, S., Tasaki, J., Takechi, M.
- Source
- Full text @ Birth Defects Res

Phenotype of wild-type embryos exposed to Pladienolide-B (PB). (a) Ratio of different phenotypes observed in PB-exposed wild-type (ICR) embryos at E10.5. Phenotypes of embryos exposed to PB at E7.75 (top, n = 22), at E8.25 (middle, n = 16), and at E8.5 (bottom, n = 17). For all experiments, embryos were obtained from at least two pregnant mice. (b) Ratio of phenotypes in wild-type (C57BL/6J) embryos exposed to PB at E8.25. Phenotype of PB-exposed embryos examined at E8.5 (top, n = 14), at E9.0 (middle, n = 20), and at E9.5 (bottom, n = 16). For all experiments, embryos were obtained from at least two pregnant mice. (c–h) Comparison of control embryos (c–e) and embryos exposed to PB at E8.25 (f–h), assessed at E8.75 (c, f), E9.0 (d, g), and E9.5 (e, h). White arrows in (g) and (h) show NTD in the forebrain and hidbrain. Yellow arrowhead in (g) and yellow arrow in (h) indicates the neural tube and the PA1, respectively. (i) Crown-rump length of control embryos and embryos exposed to PB at E8.25, evaluated at E9.0 (left) and E9.5 (right). The dots represent individual embryos obtained from two pregnant mice. (j, n) Transmission Electron Microscopy (TEM) analysis of the neuroepithelium at E8.5 of control embryos (j) and embryos exposed to PB at E8.25 (n). (k–m, o–q) Immunofluorescence imaging of E9.5 neuroepithelium in control embryos (k–m) and embryos exposed to PB at E8.25 (o–q). Hoechst nuclear (k, o) and N-cadherin staining (l, p), and merge (m, q) images are shown. For fluorescent staining experiment, n = 3 obtained from two control pregnant mice (k–m) or n = 4 obtained from three PB-exposed pregnant mice (o–q). Only one sample was examined for TEM analysis, and consistent results as immunostaining were obtained. (r) An illustration showing the method for measuring the angle of the cell nucleus. The angle of the long axis of the nucleus (blue oval) in the neuroepithelium were measured, and the mean angle for each individual was calculated. The difference between the angle of each cell and the mean angle was measured. (n = 3, rectangle bars, obtained from two pregnant mice. 15–20 nuclei were examined in each embryo). (s) The length-to-width ratio of the nucleus (blue oval) in the neuroepithelium was calculated. The dots represent individual embryos obtained from two control or two PB-exposed pregnant mice. *: p < 0.05, **: p < 0.01, ***p < 0.001 (Student's t-test, F-test). Scale bar: 200 μm for (c, f), 400 μm for (d, e, g, h), 10 μm for (j, n), and 20 μm for (k, o). |
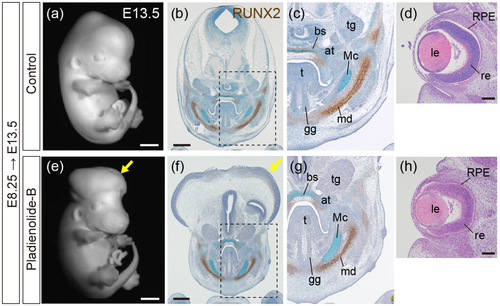
Histological analysis of wild-type fetuses exposed to PB. (a, e) Whole-mount fetuses at E13.5, control (a) and PB-exposed at E8.25 (e). (b, c, f, g) Immunohistochemistry for RUNX2 (brown) with Alcian blue and Toluidine blue staining. Frontal sections of E13.5 control fetuses (b, c) and fetuses exposed to PB at E8.25 (f, g). (c, g) Magnified views of the areas outlined by hatched lines in (b, f). (d, h) Hematoxylin–Eosin staining of frontal sections of the eye at E13.5 in control fetuses (d) and fetuses exposed to PB at E8.25 (h). bs, basisphenoid bone; tg: Trigeminal ganglion; at, ala temporalis; t, tongue; Mc, Meckel cartilage; gg, genioglossus muscle; le, lens; md, mandible; re, retina; RPE, retinal pigment epithelium. Scale bar: 1 mm for (a, e), 500 μm for (b, f), and 100 μm for (d, h). n = 3 obtained from one ICR pregnant mouse, and consistent results were obtained. |
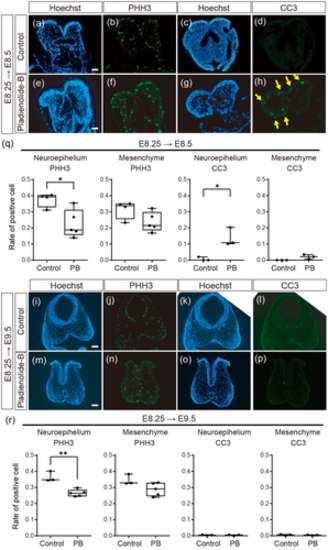
Immunohistochemistry of PHH3 and CC3 in wild-type embryos. (a–d) Frontal sections of control embryos at E8.5 and (e–h) frontal sections of E8.5 embryos exposed to PB at E8.25. (a, c, e, g) Hoechest, (b, f) PHH3, and (d, h) CC3 immunofluorescent signals. (i–l) Frontal sections of control embryos at E9.5 and (m–p) and frontal sections of E9.5 embryos exposed to PB at E8.25. (i, k, m, o) Hoechest, (j, n) PHH3, and (l, p) CC3 immunofluorescent signals. n = 3 for each experiment in (a–h) and (i–p). (q, r) Ratio of PHH3 and CC3 positive cells in the neuroepithelium and mesenchyme in E8.5 (q) or E9.5 (r) embryos of control and PB-exposed at E8.25. For (q) and (r), the cell rates were calculated by the positive cell number per nucleus number in the same area. The dots in (q) and (r) represent individual embryos obtained from at least two control or two PB-treated pregnant mice. *: p < 0.05, **: p < 0.01 (Student's t-test). Scale bar: 50 μm for (a, e) and 100 μm for (i, m). |

Phenotype of Sf3B4+/− embryos exposed to PB. (a) Ratio of phenotype of wild-type (top, n = 11) and Sf3B4+/− (bottom, n = 6) embryos at E10.5 exposed to PB at E8.25. Embryos were obtained from three pregnant mice. (b) Wild-type and (c) Sf3B4+/− embryos at E9.5 exposed to PB at E8.25. Yellow arrow indicates the PA1 in the Sf3B4+/− embryo. (d–k) Frontal sections of E8.5 wild-type (d–g) and Sf3B4+/− (h–k) embryos exposed to PB at E8.25. (d, f, h, j) Hoechest, (e, i) PHH3, and (g, k) CC3 fluorescent signals. (l) Ratio of PHH3 and CC3 positive cells in the neuroepithelium and mesenchyme in E8.5 wild-type and Sf3B4+/− embryos exposed to PB at E8.25. (m–u) Frontal sections of wild-type (m–p) and Sf3B4+/− (q–u) embryos at E9.5 exposed to PB at E8.25. (m, o, q, s) Hoechest, (n, r) PHH3, and (p, t) CC3 fluorescent signals. (u) Fluorescent signal of AP2 on the same section as (t). (v) Overlay image of the white box area in (s–u). Cells overlapping CC3 (green) and AP2 (magenta) signals are indicated in white. n = 3 for each experiment in (d–k) and (m–v). (w) Ratio of PHH3 and CC3 positive cells in the neuroepithelium and mesenchyme in E9.5 wild-type and Sf3B4+/− embryos exposed to PB at E8.25. For (l) and (w), the cell rates were calculated by the positive cell number per nucleus number in the same area. The dots in (l) and (w) represent individual embryos obtained from at least two pregnant mice. *: p < 0.05, ***: p < 0.001 (Student's t-test). Scale bar: 400 μm for (b, c), 50 μm for (d, h) and 100 μm for (m, q). |

Morphological phenotype resulting from PB treatment in zebrafish embryos at 24 hpf. (a–d) Comparison of overall morphology and body length between control embryos and PB-treated embryos. Black line in the panel (a) indicates the measured length from the head to tail. (e) Quantification of the length from the head to tail. ***p < 0.001 (one-way ANOVA followed by Dunnett's multiple comparison test). (f–m′) Effects of PB (200 nM) on neural crest cells in the pharyngeal arch (PA)s which is addressed by the yellow arrowheads (g–k′) and major axonal trajectories and commissure neurons (h–i′). The trigeminal ganglion is marked by the white arrowhead. Brain (midbrain) is indicated by the bracket ((i), (m)), and eye is indicated by the arrowhead ((i′), (m′)) were analyzed. n = 30 for experiment for (f–i) and (j–m). (n) Quantification of the length of the midbrain shown in panels (i) and (m). ***: p < 0.001 (one-way ANOVA followed by Dunnett's multiple comparison test). Scale bar: 100 μm. The dots in (e) and (n) represent individual embryos examined. All experiments were performed in three biological replicates. |
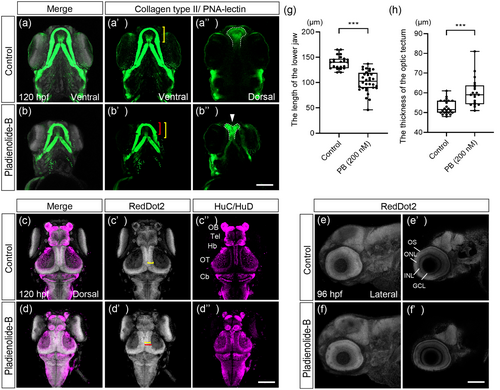
Craniofacial malformation and structural abnormalities of the brain and eye in PB-exposed embryos at 96 and 120 hpf. (a–b″) Immunofluorescence images of the control and PB-treated (200 nM) embryos. Samples were stained with anti-collagen type II antibody and PNA-lectin to visualize facial cartilages. The Meckel's cartilage ((a′), (b′), ventral view) and ethmoid plate ((a″), (b″), dorsal view) indicated by white arrowhead were analyzed. The bracket indicates the length of the Meckel's cartilage in control (yellow bracket) and PB-treated embryos (red bracket), while dashed lines outline the ethmoid plate. (c–d″) Samples were stained with anti-HuC/HuD and RedDot2 to analyze brain defects. Bracket shows the thickness of optic tectum in control (yellow bracket) and PB-treated embryos (red bracket). (e–f′) Eye morphology ((e), (f)) and eye layer ((e′), (f′)) were analyzed. (g) Quantification of the length of the lower jaw shown in panels (a′) and (b′). (h) Quantification of the thickness of the optic tectum shown in panels (c′) and (d′). ***: p < 0.001 (one-way ANOVA followed by Dunnett's multiple comparison test). Cb, cerebellum; GCL, ganglion cell layer; Hb, habenula; INL, inner nuclear layer; OB, olfactory bulb; ONL, outer nuclear layer; OS, outer segment of photoreceptor; OT, optic tectum; Tel, telencephalon. Scale bars: 100 μm. n = 19, 28, 21, and 28 for experiment for (a, c), (b, d), (e), and (f), respectively. The dots in (g) and (h) represent individual embryos examined. All experiments were performed in three biological replicates. |

Mitosis and apoptosis in migratory CNCCs and CNCCs in PB-treated embryos at 24 hpf. (a–b′) Immunofluorescence images of mitotic ability of CNCCs. Samples were stained with anti-GFP antibody and anti-PHH3 antibody. (a′, b′) Magnified view of the rectangle in the panels (a) and (b). Green and magenta represent represents CNCCs and mitotic cells, respectively. The PA1 is defined by dashed line. (c–d′) Immunofluorescence images of apoptosis in CNCCs. Samples were stained with anti-GFP antibody and anti-CC3 antibody. (c′, d′) Magnified view of the rectangle in the panels (c) and (d). Green and magenta represent CNCCs and apoptotic CNNCs, respectively. n = 22 (control), n = 22 (PB 200 nM). (e) Quantification of the number of PHH3-positive migratory CNCCs and CNCCs in the PA1. (f) Quantification of the number of CC3-positive migratory CNCCs and CNCCs in the PA1. ***: p < 0.001 (one-way ANOVA followed by Dunnett's multiple comparison test). Scale bars: 100 μm (a–d), 50 μm (a′–d′). The dots in (e) and (f) represent individual embryos examined. All experiments were performed in three biological replicates. |

CNCCs migration in PB (200 nM)-treated sox10:EGFP embryos at 13 ss. (a–b) Overall defects were analyzed at 13 ss. (c–d′) Live DIC (differential interference contrast, (c), (d)) and fluorescence imaging (c′, d′) of CNCC migration in control and PB-treated embryos. The yellow arrowheads in (c) and (d) indicate the position of the midbrain-hindbrain boundary (MHB) at which CNCCs start migration. The white arrowhead in (c′) and (d′) indicates the frontier of migratory CNCCs via the frontonasal pathway. Dashed line indicates the eye (e). Scale bars: 100 μm. n = 30 for each experiment. All experiments were performed in three biological replicates. |