
- Title
-
Tuning collective behaviour in zebrafish with genetic modification
- Authors
- Yang, Y., Kawafi, A., Tong, Q., Kague, E., Hammond, C.L., Royall, C.P.
- Source
- Full text @ PLoS Comput. Biol.
Effects of |
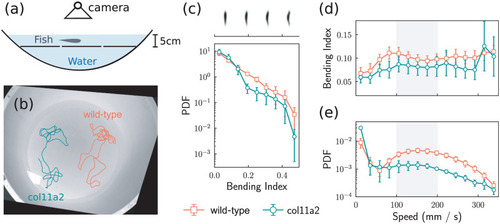
Differential swimming shape analysis of (a) illustration of our experimental setup for recording the 2d movement of fish. (b) Typical trajectories of mutant fish and wild–type fish replotted on top of the captured image. (c) Distribution of the bending index calculated from the image of the fish. The top panel, sharing the same x-axis with respect to the distribution plot, shows the characteristic shapes at different bending index values. (d) Average bending indices, calculated from the images of the fish shapes, for the wild–type fish and the mutant fish at different speed values. (e) Distribution of the speed values. Error bars represent the standard error calculated from 5 different fish. |
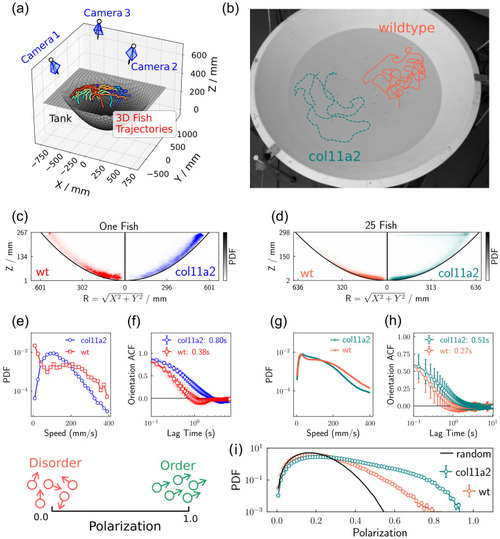
The behaviour of wild–type fish and mutant fish swimming in a three dimensional space. (a) A schematic of the experimental apparatus. The fish were placed in a bowl-shaped tank, and their movements were recorded by three synchronized cameras. The 3d trajectories of the fish were calculated from the recorded videos. The coloured line plots represent the movement of 25 mutant fish in 5 seconds. (b) The swimming trajectories for a single wild–type and a single mutant fish re–projected onto the recorded image, highlighting the difference in the persistence of the motion. (c, d) The joint probability distribution of the latitude radius ( |
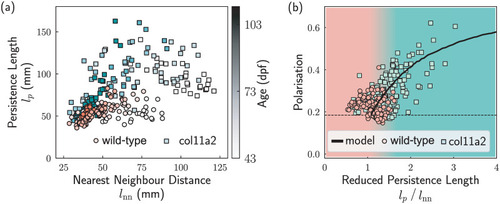
Important lengthscales of 25 wild–type fish (○) and mutant fish (▫). (a) The nearest neighbour distance and the persistence length for the fish. Each scatter represents the average value in 2 minutes, whose grayscale values represent the age of the fish. (b) The relationship between the group polarisation and the reduced persistence length values. The data points represent the experiments and the line represents the simulation result where the fish obey the updating rule in |