
|
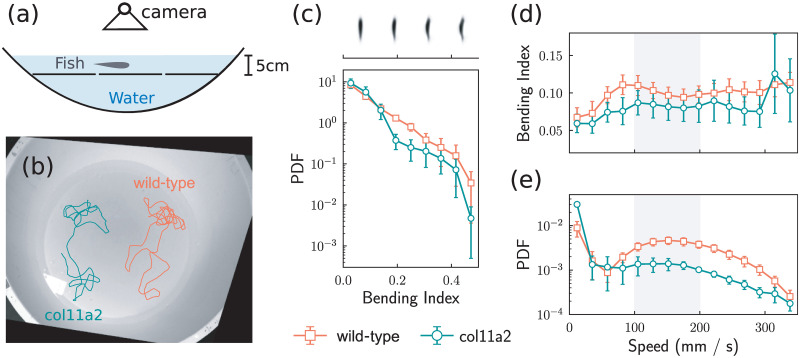
Fig 2
Differential swimming shape analysis of
(a) illustration of our experimental setup for recording the 2d movement of fish. (b) Typical trajectories of mutant fish and wild–type fish replotted on top of the captured image. (c) Distribution of the bending index calculated from the image of the fish. The top panel, sharing the same x-axis with respect to the distribution plot, shows the characteristic shapes at different bending index values. (d) Average bending indices, calculated from the images of the fish shapes, for the wild–type fish and the mutant fish at different speed values. (e) Distribution of the speed values. Error bars represent the standard error calculated from 5 different fish.