
|
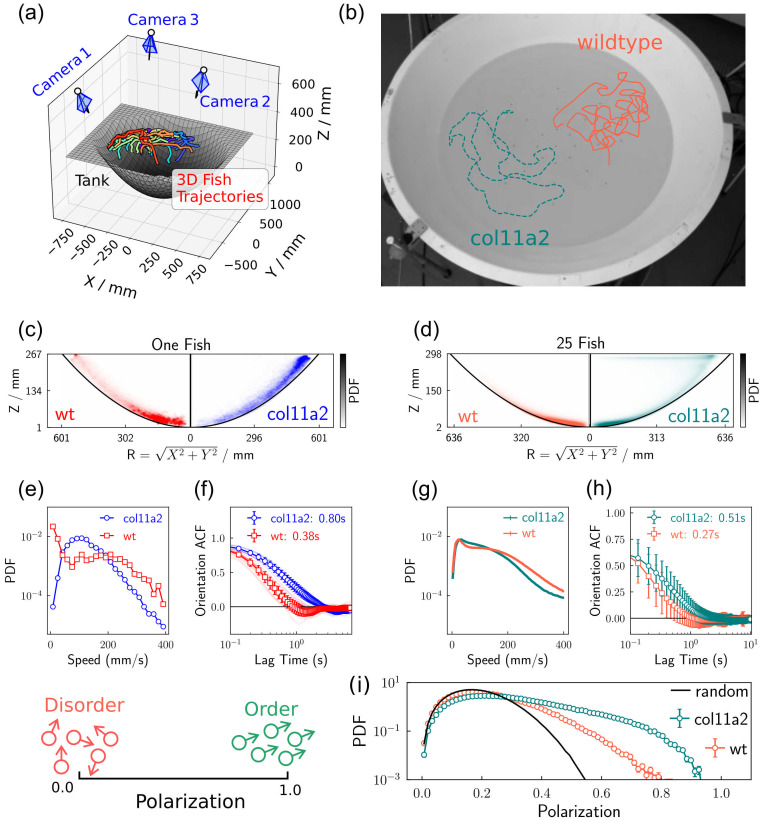
Fig 3 The behaviour of wild–type fish and mutant fish swimming in a three dimensional space.
(a) A schematic of the experimental apparatus. The fish were placed in a bowl-shaped tank, and their movements were recorded by three synchronized cameras. The 3d trajectories of the fish were calculated from the recorded videos. The coloured line plots represent the movement of 25 mutant fish in 5 seconds. (b) The swimming trajectories for a single wild–type and a single mutant fish re–projected onto the recorded image, highlighting the difference in the persistence of the motion. (c, d) The joint probability distribution of the latitude radius (