FIGURE SUMMARY
Title

The functional roles of zebrafish HoxA- and HoxD-related clusters in the pectoral fin development

Authors
Ishizaka, M., Maeno, A., Nakazawa, H., Fujii, R., Oikawa, S., Tani, T., Kanno, H., Koita, R., Kawamura, A.
Source
Full text @ Sci. Rep.

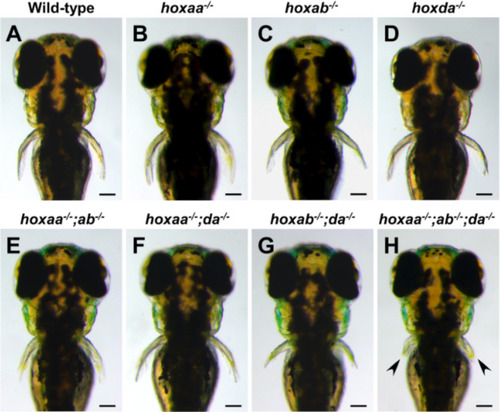
Shortening of pectoral fins in hoxaa; hoxab;hoxda cluster-deficient larvae. (AH) Shortening of the pectoral fins in hoxaa, hoxab, and hoxda cluster-deleted mutants. Dorsal views of larvae at 3 dpf. Arrowhead indicates severely truncated pectoral fins in hoxaa−/−;hoxab−/−;hoxda−/− larva. Embryos were obtained from the natural intercrosses between hoxaa+/−;hoxab+/−;hoxda+/− triple hemizygous mutant fish and were incubated at 28.5 °C in water containing methylene blue as an anti-fungal agent (green signal in the otic vesicle). After photography, PCR-based genotyping was performed. At least three individuals (n > 3) were identified for each genotype, and the representative larvae are shown. Scale bar, 100 μm.

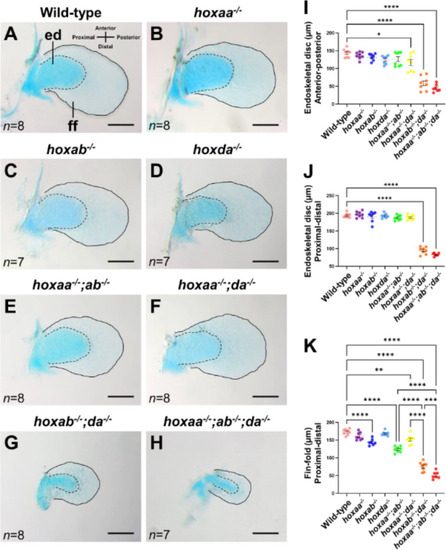
Shortening of the endoskeletal disc and fin-fold of the pectoral fins in
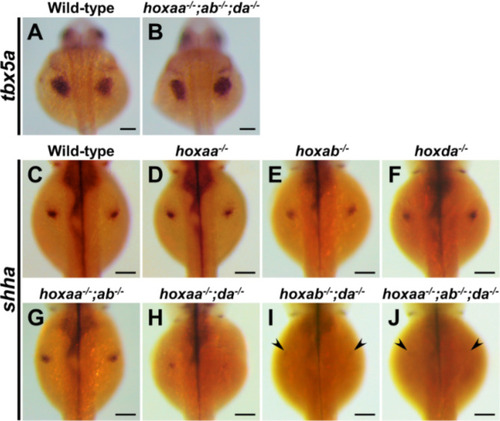
 hoxaa−/−;hoxab−/−;hoxda−/− larvae. (AH) Reduction of the endoskeletal disc (ed) and fin-fold (ff) in the pectoral fins of hoxaa; hoxab; hoxda cluster-deleted mutants. Alcian blue staining was performed to distinguish cartilaginous cells (endoskeletal disc) and non-cartilaginous fin-fold in larvae at 5 dpf. After the staining, the pectoral fins were manually dissected and mounted on a glass slide. The margin of the endoskeletal disc is emphasized with a dashed line, and the margin of the fin-fold is highlighted with a line. Proximal to the left. Scale bar, 100 μm. The number of dissected pectoral fins for which lengths were measured is noted in the left bottom. (IK) Comparisons of the length of the endoskeletal disc and fin-fold in hoxaa; hoxab; hoxda cluster-deleted mutants. The lengths of the endoskeletal disc and the fin-fold were measured by ImageJ. The Tukey–Kramer test was performed with *P < 0.05, **P < 0.01, ***P < 0.001, and ****P < 0.0001. Error bars represent the standard error of the mean.

Expression of shha in developing pectoral fin is significantly decreased in hoxaa; hoxab; hoxda triple homozygous mutants. Whole-mount in situ hybridization was performed. Dorsal view. (A,B) Expression patterns of tbx5a in wild-type siblings (n = 5) and hoxaa−/−;hoxab−/−;hoxda−/− embryos (n = 3) at 24 hpf. (CJ) Expression patterns of shha in the embryos at 48 hpf which were derived from several intercrosses between hoxaa+/−;hoxab+/−;hoxda+/− fish. Prior to imaging, PCR-based genotyping was performed using genomic DNA extracted from the tail of the stained embryos. At least three embryos were identified for each genotype to confirm the reproducibility. Arrowhead indicates significantly decreased signal of shha in the pectoral fin primordium of hoxab−/−;hoxda−/− and hoxaa−/−;hoxab−/−;hoxda−/− embryos. Scale bar, 100 μm.

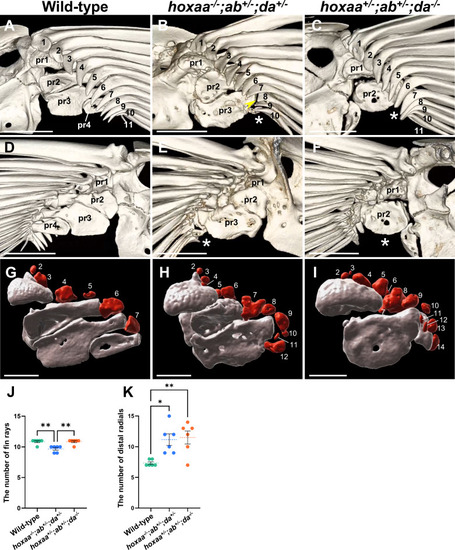
Skeletal elements in the posterior regions of the pectoral fin are preferentially affected in hoxaa−/−;hoxab+/−;hoxda+/− and hoxaa+/−;hoxab+/−;hoxda−/− adult fish. Micro-CT scan analysis of the skeletal structures in zebrafish pectoral fins. Both sides of the pectoral fins in wild-type (n = 3), hoxaa−/−;hoxab+/−;hoxda+/− (n = 3), and hoxaa+/−;hoxab+/−;hoxda−/− (n = 3) adult zebrafish were analyzed. The left pectoral fins are shown. (AC) The magnified views of pectoral fin endoskeletons from the lateral side. (DF) Magnified views of the pectoral fin endoskeletons from the opposite medial side in the same specimens shown in A-C. Proximal radials (pr1-pr4) are indicated. Fin rays are numbered from the anterior to the posterior. The asterisk indicates the absence of the posterior proximal radials. The arrowhead indicates the loss of the proximal tip of the fin rays. Anterior is to the top. The 3D movies were created using OsiriX MD ver13 and are available in Movies S1–3. Scale bar, 500 μm. (GI) Magnified images of proximal radials (grey) and distal radials (red) as revealed by CT segmentation. The same specimens as above were used for each genotype. Fin rays were removed by image processing. The first distal radials are not shown due to their distance from the remaining distal radials. 3D movies were created using Imaris ver10 (Movies S4–6). A 2D movie showing the distal radials and proximal radials was also created using Imaris ver10 and is provided in Movie S7. Scale bar, 250 μm. (J, K) Comparisons of the number of fin rays and distal radials between wild-type, hoxaa−/−;hoxab+/−;hoxda+/− and hoxaa+/−;hoxab+/−;hoxda−/− adult fish. The Tukey-Kramer test was performed with *P < 0.05 and **P < 0.01.

Acknowledgments
This image is the copyrighted work of the attributed author or publisher, and ZFIN has permission only to display this image to its users. Additional permissions should be obtained from the applicable author or publisher of the image. Full text @ Sci. Rep.