
- Title
-
Slc4a7 Regulates Retina Development in Zebrafish
- Authors
- Zhuang, Y., Li, D., Tang, C., Zhao, X., Wang, R., Tao, D., Huang, X., Liu, X.
- Source
- Full text @ Int. J. Mol. Sci.
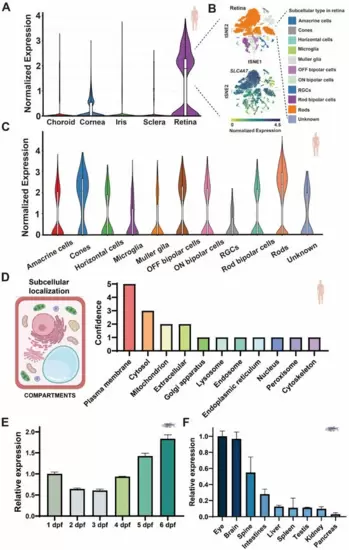
The expression profile of SLC4A7 (slc4a7) in both humans and zebrafish. (A) Profiling of human single-cell RNA sequencing unveils SLC4A7 expression in various ocular tissues, including the retina, cornea, iris, sclera, and choroid. (B) Single-cell transcriptome profiling and SLC4A7 gene signatures of the human retina. The upper tSNE plot showing major cell subsets in human retina. The lower tSNE plot of all cells colored by enrichment of SLC4A7 gene signatures. (C) Detailed expression pattern of SLC4A7 across various cell types in the human retina. (D) Human subcellular localization of SLC4A7 provided by COMPARTMENTS. (E,F) qRT-PCR display the time series (E) and the tissue-specific (F) expression pattern of slc4a7 in zebrafish larvae. Bar plots are shown as the mean ± std. Label of human and zebrafish indicating the species source of the data. The normalized expression values refer to the standardized measure of gene expression levels across different cells or cell types in a single-cell RNA sequencing dataset, as calculated and provided by the online analysis tool, Single Cell Portal. The relative expression values were calculated relative to the expression of the reference gene β-actin. The dashed lines indicate detailed information about the corresponding tissues or figures. Human or zebrafish icons indicate the species origin of the data. |
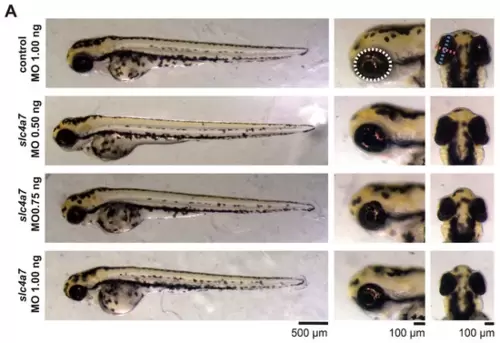
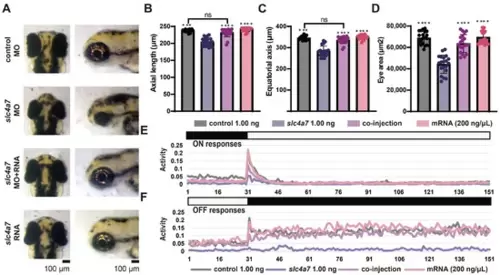
Slc4a7-deficient zebrafish morphants exhibited marked ocular changes. (A) Whole-body view (scale bar = 500 μm), lateral view (scale bar = 100 μm), and vertical view (scale bar = 100 μm) of zebrafish larvae at 3 dpf. The ocular area is indicated by white circles. The ocular axis is indicated by a red dashed line. The equatorial axis is indicated by a blue dashed line. (B–E) The measurement of ocular axis length, equatorial length, ocular area, and the ratio of ocular length to body length. n = 25 in each group. Bar plots are shown as the mean ± s.e.m. Data were analyzed using one-way ANOVA followed by Tukey’s post hoc tests, *** p < 0.001, and **** p < 0.0001 indicate significant differences from the control 1.00 ng group. The scattered circles, squares, and triangles of various colors in the bar chart denote individual values of zebrafish eye-related parameters for different groups. |
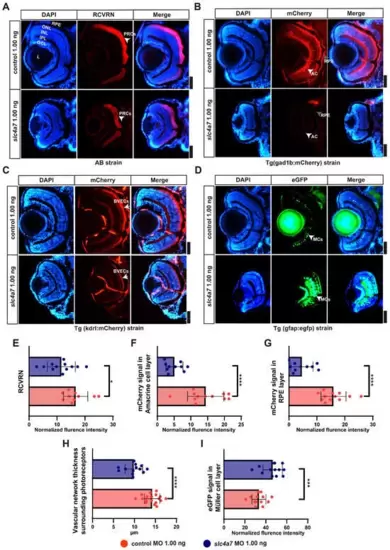
Loss of slc4a7 leads to retinal abnormalities in zebrafish larvae. (A) Immunostaining for RCVRN in slc4a7-deficient and control AB zebrafish strains at 5 dpf. (B) The fluorescence imaging depicts retinal pigment epithelium cells and amacrine cells in slc4a7-deficient and control Tg (gad1b:mCherry) strain at 5 dpf. (C) The fluorescence imaging focusing on blood vessel endothelial cells in slc4a7-deficient and control Tg(kdrl:mCherry) strains at 5 dpf. (D) The fluorescence imaging illustrates Müller cells in slc4a7-deficient and control Tg (gfap:egfp) strains at 5 dpf. (E) Statistical results for normalized fluorescence intensity of RCVRN. (F,G) Statistical results for normalized fluorescence intensity of mCherry signal in amacrine cells (ACs), (F), and the RPE layer (G). (H) Statistical results for vascular network thickness surrounding photoreceptors. (I) Statistical results for the normalized fluorescence intensity of the eGFP signal in Müller cell layer. Scale bar = 50 μm. Bar plots are shown as the mean ± s.e.m. The t-test was performed between the two groups. * p < 0.05, *** p < 0.001, **** p < 0.0001. GCL: ganglion cell layer; IPL: inner plexiform layer; INL: inner nuclear layer; OPL: outer plexiform layer; ONL: outer nuclear layer. |

Knockdown of slc4a7 resulted in a marked elevation of apoptosis in the zebrafish retina. TUNEL assay was used to detect apoptosis in larval retinas at 5 dpf. Knockdown of slc4a7 led to a marked elevation in the number of TUNEL+ cells in the retina at 5 days dpf. Scale bars = 20 μm. Blue indicates cell nucleus stained by DAPI. Red indicates cells with a positive TUNEL reaction. |
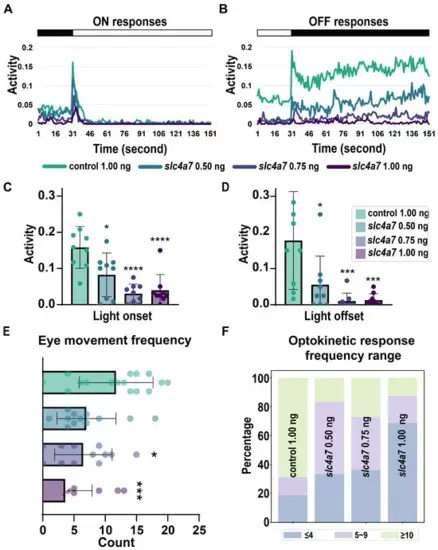
Zebrafish morphants lacking slc4a7 exhibited impaired visual behaviors. (A,B) VMR testing results are depicted in the line charts for slc4a7-deficient zebrafish morphants. (C,D) Scatter plots with bar show the quantification of ON responses and OFF responses. Each point represents the average activity of 12 larvae within the group at the moment of each light environment change. Error bars represent standard deviation (STD). (E,F) Frequency distributions of eye movements (times/minute) in zebrafish larvae are illustrated in the stacked boxes. Data were analyzed using one-way ANOVA with Tukey’s post hoc tests, * p < 0.05, *** p < 0.001, **** p < 0.0001. The scattered circles of various colors in the bar chart denote individual values of zebrafish eye-related parameters for different groups. |
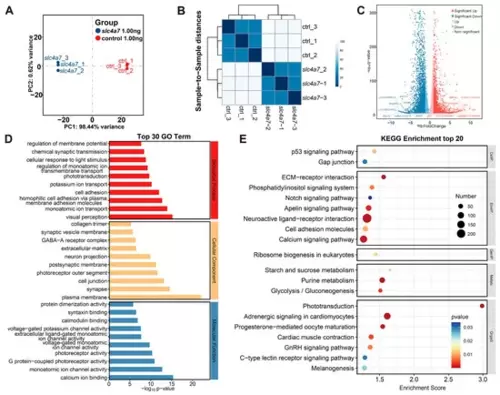
Transcriptional profiling of bulbus oculi from slc4a7-deficient zebrafish morphants. (A) Principal component analysis (PCA) of the expressed genes showing slc4a7 and control sample separation. (B) Heatmap of sample-to-sample distances. (C) Volcano plot showing highlights of DEGs from slc4a7 KD eyes compared with control eyes. (D) GO analysis identified the top 30 most significant GO terms in the slc4a7 1.00 ng group compared to the control 1.00 ng group. (E) Significantly enriched KEGG pathways (top 20) in the slc4a7 1.00 ng group compared to the control 1.00 ng group. |
Slc4a7 mRNA compensation rescues phenotypes in slc4a7-deficient morphants. (A) Enlarged vertical and lateral views of larval eyeballs. Larvae injected with slc4a7 MO and full-length slc4a7 mRNA exhibit normal-sized eyeballs at 3 dpf. Scale bar = 100 mm. (B–D) Statistical analysis of axial length and ocular area. (E,F) VMR testing demonstrates significant recovery of both ON and OFF responses in slc4a7-deficient zebrafish compensated with mRNA compared to those without compensation. n = 20 in each group. Rescue experiments were repeated three times. Bar plots represent the mean ± s.e.m. Data were analyzed using one-way ANOVA followed by Tukey’s post hoc test, *** p < 0.001, **** p < 0.0001, indicate significant differences from the slc4a7 1.00 ng group. ns means no significance. The scattered circles of various colors in the bar chart denote individual values of zebrafish eye-related parameters for different groups. |