
Image
|
Figure Caption
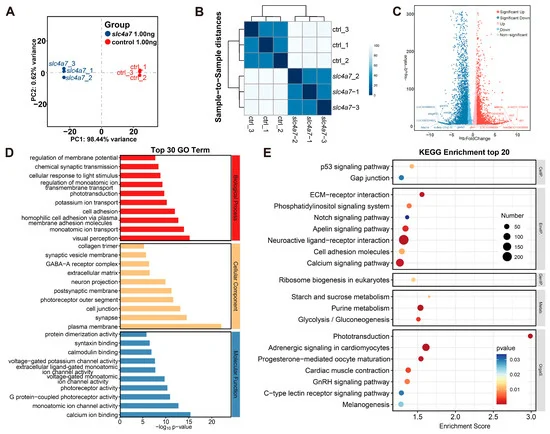
Fig. 6 Transcriptional profiling of bulbus oculi from slc4a7-deficient zebrafish morphants. (A) Principal component analysis (PCA) of the expressed genes showing slc4a7 and control sample separation. (B) Heatmap of sample-to-sample distances. (C) Volcano plot showing highlights of DEGs from slc4a7 KD eyes compared with control eyes. (D) GO analysis identified the top 30 most significant GO terms in the slc4a7 1.00 ng group compared to the control 1.00 ng group. (E) Significantly enriched KEGG pathways (top 20) in the slc4a7 1.00 ng group compared to the control 1.00 ng group.
Acknowledgments
This image is the copyrighted work of the attributed author or publisher, and
ZFIN has permission only to display this image to its users.
Additional permissions should be obtained from the applicable author or publisher of the image.
Full text @ Int. J. Mol. Sci.