
- Title
-
Neuropeptidergic regulation of neuromuscular signaling in larval zebrafish alters swimming behavior and synaptic transmission
- Authors
- Dill, H., Liewald, J.F., Becker, M., Seidenthal, M., Gottschalk, A.
- Source
- Full text @ iScience
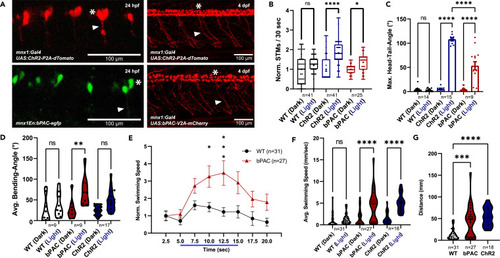
Expression and stimulation of ChR2 and bPAC in zebrafish motor neurons alter locomotion behavior (A) Confocal images of Tg[mnx1:Gal4]/Tg[UAS:ChR2-P2A-dTomato] and Tg[mnx1En:bPAC-egfp] transgenic embryos (24 hpf) and of Tg[mnx1:Gal4]/Tg[UAS:ChR2-P2A-dTomato] and Tg[mnx1:Gal4]/Tg[UAS:bPAC-V2A-mCherry] double transgenic larvae (4 dpf). Asterisks mark motor neuron cell bodies, arrowheads motor axons. (B) Spontaneous (dark) and evoked (light) tail movements (STMs/ETMs) in 24 hpf embryos. (C) Head-tail angles in immobilized larvae under dark and blue-light conditions. The maximum head-tail angles were determined for wild-type (WT), bPAC (Tg[mnx1: Gal4]/Tg[UAS: bPAC-V2A-mCherry]), and ChR2 (Tg[mnx1:Gal4]/Tg[UAS:ChR2-P2A-dTomato] transgenic larvae (4 dpf). (D) Bending angles of freely swimming larvae under dark and photostimulated conditions. The bending angles were determined for animals as in (C). (E) Swimming speed was measured for individuals 4 dpf before, during, and after blue light stimulation. (F) Average swimming speed with and without blue light stimulation. (G) Distance traveled during the photostimulation phase. In (B), median (cross), 25/75 quartiles, and min to max are shown; in (C) and (E), means ± SEM; in (D) and (F and G), median and 25/75 quartiles (thick and thin black lines), min to max are shown. in (B), Kruskal-Wallis test with Dunn post hoc test.; in (C–F), two-way ANOVA; in (G), one-way ANOVA, each with Tukey multiple comparisons of means. Statistical significance given as ∗∗∗∗p < 0.0001, ∗∗∗p < 0.001, ∗∗p < 0.01, ∗p < 0.05. |

Key components of the neuropeptide signaling pathway are expressed in motor neurons (A) Bright-field images of in situ hybridization stainings for cpe and tac1 mRNAs, respectively. Scale bars, 100 μm. (B) Schematic representation of cpe and tac1 gene loci illustrating the CRISPR-Cas9 knockout strategy. Asterisks indicate sgRNA target sites. TSS, transcriptional start site; ATG, start codon; TC, termination codon; PTC, premature termination codon. (C) qPCR showing cpe mRNA levels relative to gapdh. (D) qPCR showing tac1 mRNA levels relative to gapdh. (E) Percentage of wild-type, heterozygous, and homozygous genotypes within a population of 4 dpf cpe or tac1 mutant larvae. In (C) and (D), means ± SEM are shown; Student’s t test. Statistical significance given as ∗∗∗p < 0.001. |

Enhanced locomotion behavior during bPAC stimulation in cpe and tac1 knockouts (A) cpe homozygous knockouts and wild-type siblings (4 dpf) in the Tg[mnx1:Gal4]/Tg[UAS:bPAC-V2A-mCherry] double transgenic background were subjected to a swimming assay and swimming speed measured during blue light stimulation as indicated. Values are normalized to the first 2.5 s before illumination. Two-way ANOVA with Tukey multiple comparisons of means. (B) Swimming speed of tac1 homozygous knockouts and respective wild-type siblings (4 dpf) carrying the Tg[mnx1:Gal4]/Tg[UAS:bPAC-V2A-mCherry] transgenes before, during, and after bPAC activation. Values are normalized to the first 2.5 s before illumination. Two-way ANOVA with Tukey multiple comparisons of means. Data are displayed as means ± SEM. Statistical significance given as ∗∗∗p < 0.001, ∗∗p < 0.01, ∗p < 0.05. |

Post-synaptic recording from the NMJ following bPAC photostimulation demonstrates altered signaling in cpe and tac1 knockout animals (A) Representative recording of mEPSCs before, during, and after bPAC photostimulation (blue bar) in a wild-type animal expressing bPAC in cholinergic motor neurons. (B) mEPSC frequencies were analyzed in different time bins, as indicated, in wild-type animals, as well as in bPAC-expressing animals, either wild-type siblings or cpe−/− or tac1−/− knockout animals. (C) Normalized mEPSC rates analyzed in 5 s time bins, as indicated, in the respective animals as in (B). Blue shade indicates time of blue light exposure. Data are displayed as means ± SEM. (D) Number of mEPSC events of a given amplitude interval, as indicated, observed over a 30 s interval before photostimulation (upper panel) or during the photostimulation (lower panel), for animals expressing bPAC, in wild-type, or cpe−/− or tac1−/− knockout animals. (E) mEPSC amplitudes were analyzed for each strain in 30 s intervals as indicated, before, during, and after photostimulation. (F) All mEPSC amplitudes across all intervals were analyzed for bPAC-expressing animals (wild type, or cpe−/− or tac1−/− knockouts, as indicated). In (B) and (D–F), median and 25/75 quartiles (thick and thin black lines), min to max are shown. Two-way ANOVA, Tukey test. In (B) and (E), red significance labels analyses using Fisher Test. Statistical significance given as ∗∗p < 0.01, ∗p < 0.05; n.s., non-significant. |
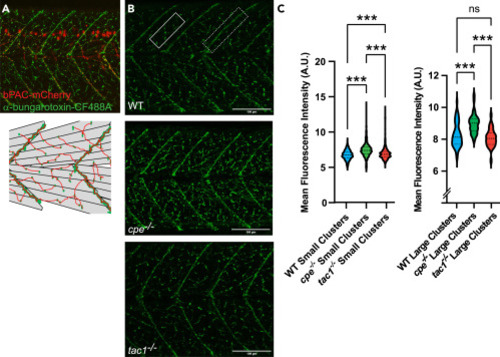
Abundance of nAChRs on muscle cells is altered in neuropeptide mutants (A) Representative α-bungarotoxin staining at 4 dpf (upper panel). nAChR clusters in green, bPAC-expressing motor neurons in red. Diagram of skeletal muscle cells and clusters of nAChRs on the cell surface (lower panel). Large receptor clusters are assembled on somite boundaries; small receptor clusters are distributed in between. (B) α-bungarotoxin staining at 4 dpf on wild-type, cpe−/−, and tac1−/− animals. The rectangle in the upper panel represents an area containing small receptor clusters on fast muscle; the dashed rectangle marks larger clusters at the end of slow muscle cells. (C) Quantification of fluorescence intensity of small and large receptor clusters in the respective zebrafish strains. Median and 25/75 quartiles (thick and thin black lines), min to max are shown. Scale bars in (B): 100 μm. One-way ANOVA with Tukey multiple comparisons of means. Statistical significance given as ∗∗∗p < 0.001; n.s., non-significant. |