
- Title
-
Fibronectin and Hand2 influence tubulogenesis during pronephros development and mesonephros regeneration in zebrafish (Danio rerio)
- Authors
- Uribe-Montes, L.C., Sanabria-Camargo, C.A., Piñeros-Romero, C.C., Otálora-Tarazona, S., Ávila-Jiménez, E., Acosta-Virgüez, E., Garavito-Aguilar, Z.V.
- Source
- Full text @ PLoS One
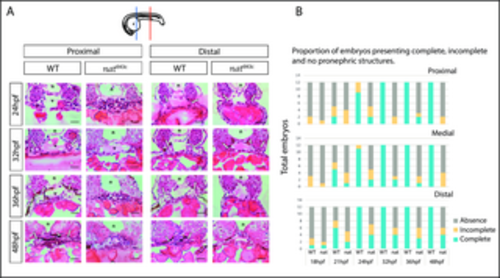
nattl43c mutants have a pronephric phenotype. A. Transversal H&E histological slides for Fn mutants and their WT siblings at proximal and distal levels. From 18 to 21 hpf no pronephric structures are visible. At 24, 32, 36, and 48 hpf, WT embryos pronephric structures (white arrows), as well as normal vascular structures (v) are noticeable. By 48 hpf WT embryos have normal intestinal lumen (i). Mutant embryos do not present normal vasculature or pronephric tubules, and by 48 hpf, mutants show poorly defined intestine and vasculature. Moreover, WT embryos show a great amount of melanocytic neural crest cells (arrowheads) whereas mutants have an exacerbated amount of blood cells. In mutants, the pronephric structure appears more frequently in distal levels than proximal levels, but they are poorly defined. n (notochord); v (vasculature); b (blood cells); i (intestine). Dorsal up. Scale bar: 15 μm. n = 12 from three independent experiments (4 embryos each). The diagram shows the level examined: blue for proximal and red for distal. B. The proportion of embryos showing complete (bilateral appearance of evident and easily recognizable pronephric tubules), incomplete (absence of one structure), or total absence (no discernible or absence) of pronephric structures in three distinctive anatomical locations (proximal, medial, distal) as examined in H&E histology. n = 12. PHENOTYPE:
|
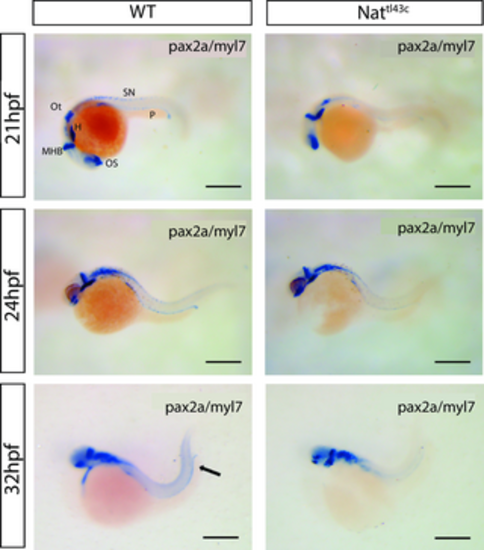
pax2 gene expression in nattl43c mutants and WT. Double in situ hybridization for pax2 (renal field) and Myl7 (heart field) genes. Even though there is a weaker signal, the expression of pax2 marker is visible in WT as well as in mutants. SN (Spinal cord neurons), P (Pronephros), Ot (Otic vesicle), H (Heart), MHB (Midbrain to Hindbrain Boundary), OS (Optic stalk). Dorsal up, anterior to the left. Scale bar: 300μm EXPRESSION / LABELING:
|
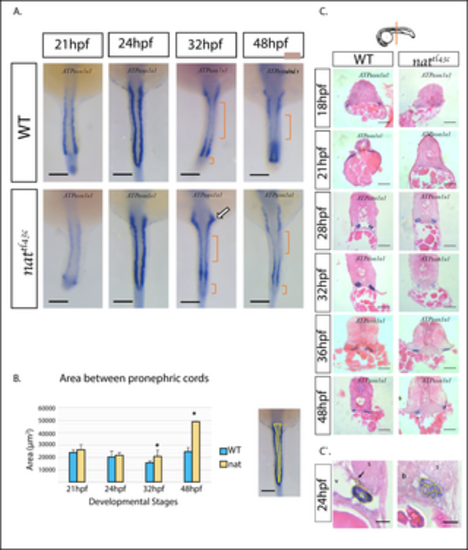
Renal cells determination occurs normally in nattl43c mutants. A. The pattern of expression from 21 to 48 hpf of Myl7 / ATPα1a.1 gene in situ hybridization. There is no major difference between the expression of WT and mutant embryos. At 32 and 48 hpf, the expression signal is localized at the anterior and medial region of the renal field (brackets), indicative of tissue segmentation. The arrow shows the presumptive Proximal Convoluted Tube (PCT). B. As indicated. n = 8, measurements were done on two independent hybridization experiments. Results presented as mean ± s.e.m. p<0.05. Dorsal view, anterior up. Scale bar: 100 μm C. H&E histology slides on ATPα1a.1 hybridized embryos. Although in most cases the pronephros was absent in mutants, they have renal cells determination as can be evidenced by the ATPα1a.1 expression signal. Dorsal up. Scale bars: 15 μm. n = 4. Diagram shows the level examined. C`. H&E histology slides on ATPα1a.1 hybridized embryos at 24 hpf show that cells are determined to renal fate but show epithelial abnormalities. WT embryos present normal organized pronephric cell clusters with a lumen and normal anatomical characteristics like Dorsal Aorta (v) and few melanocytic neural crest cells (arrow). nattl43c mutants show disorganized pronephric cells that fail to form lumen and a lower expression signal intensity. There are no melanocytic neural crest cells and there is blood cell accumulation. s (somite), v (vasculature), b (blood cells) Left side, Dorsal up. Scale bars C`: 4 μm. EXPRESSION / LABELING:
PHENOTYPE:
|
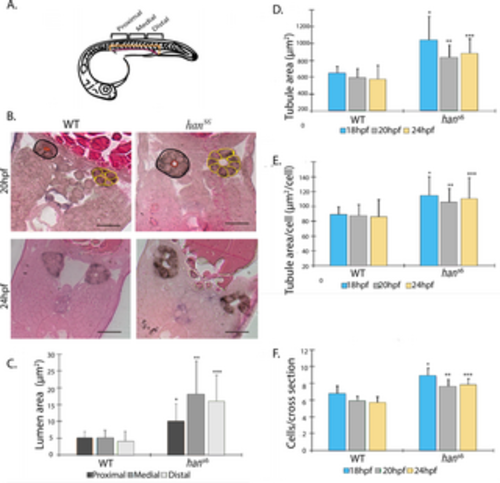
Cell and tissue characteristics of developing pronephric tubule in WT and hans6 embryos. A. Schematic of a 24hpf zebrafish embryo. Orientation of tissue sectioning was perpendicular to the A-P axis. B. Representative images of observed patterns at 20 and 24 hpf. Black circles indicate demarcated area of the tubules, red circles show the lumen and yellow circles show cells that constitute the tubules. It is possible to observe a higher cell number of cells, bigger tubule, and lumen areas in han mutants. C Lumen area differences at 24 hpf were significant along the A-P axis (n = 18; p-value≤ 0.001; Dunn’s post-hoc test). D. Tubule area differences between the two groups were significant at each evaluated stage (n = 18; p-value≤ 0.001; Dunn’s post-hoc test). E. The calculated index tubule area per cell number showed significant differences between pairs of categories at all development stages (n = 18; p-value≤ 0.001; Dunn’s post-hoc test). F Cell -counts per cross-section per stage showed significant differences between WT and hans6 embryos (n = 18; p-value≤ 0.001; Dunn’s post-hoc test). PHENOTYPE:
|

Comparison of ATP1a1a.4 pronephric tubule expression patterns during late somitogenesis of WT and hans6 embryos. A. ATP1a1a.4expression within the pronephric tubule at 24 and 20 hpf, illustrating the lateral expansion in hans6 mutants. At 18 hpf, this difference is barely noticeable. Scale bars: 100 μm. B. Pronephric tubule width measurements of WT and hans6 mutants taken at three defined levels along the A-P axis. Significant differences were found between pairs of levels compared in all plotted stages (n = 7; p-value≤ 0.005; Dunn’s post-hoc test). EXPRESSION / LABELING:
PHENOTYPE:
|
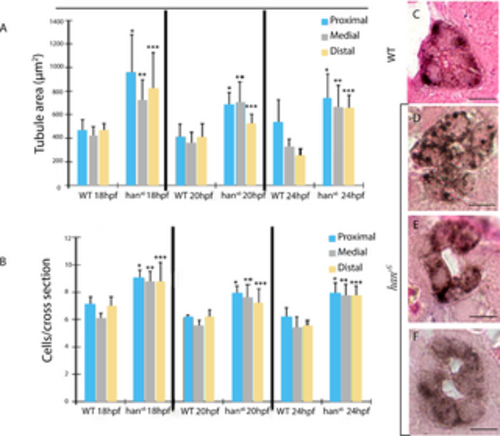
Comparison of morphometry parameters and tissue organization in WT and hans6 sections (along the anteroposterior axis) during tubulogenesis. A. Pronephric tubule area measurements and B, cell number per cross-section from 18 to 24 hpf in WT and hans6 embryos at three levels along AP axis. Significant differences were found between pairs of levels evaluated by phenotype (n = 18; p-value≤ 0.005; Dunn’s post-hoc test). Diverse defective settings of pronephric tubule organization were observed in comparison to the compacted cell assembly in WT embryos (C), such as erroneous location of cells outside the area of lumen formation (D), loss of tubule structural integrity (E), and two visible lumens (F) Scale bars: 20 μm. Brown staining corresponds to ATP1a1a.4 expression pattern in pronephric tubule PHENOTYPE:
|

General structure of gentamicin injured zebrafish kidney tissue 3, 7 and 15 days post injury compared to uninjured control. It is possible to identify glomeruli (yellow circle); proximal tubules (PT) characterized by elongated cells, darker staining and brush border towards the lumen; distal tubules (DT) with a pink pale staining and neonephrogenic clusters that are evidence of regeneration process (yellow stars). Pink stain in lumens is an indicator of cellular debris. Scale bars (black bars) measure 0.03mm. PHENOTYPE:
|
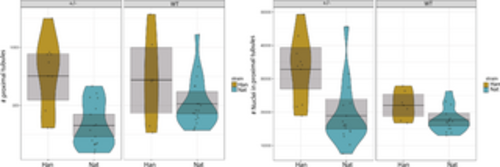
Basal tissue conditions in uninjured fish. Mixed model analysis found significant differences in number of proximal tubules (normalize by the area of tissue evaluated) and nuclei within each proximal tubule (P ≤ 0.01), with lower tubules in nat carriers and higher nuclei number in han carrier (+/-) mutants n = 3 (for each regeneration time, control and strain). PHENOTYPE:
|
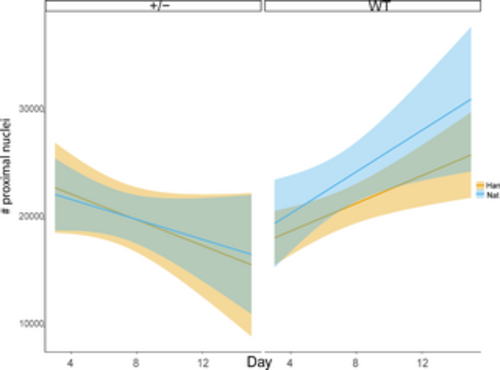
Evaluation of proximal tubule nuclei along kidney regeneration days per tubule. The lines indicate the trend, and the colored shadows represent the 95% CI confidence interval. The opposite trends show significant differences between both carriers (+/) compared to both WT (P≤0.05) n = 3 (for each regeneration time, control and strain). PHENOTYPE:
|