
IMAGE
Fig. 9
- ID
- ZDB-IMAGE-240909-9
- Publication
- Uribe-Montes et al., 2024 - Fibronectin and Hand2 influence tubulogenesis during pronephros development and mesonephros regeneration in zebrafish (Danio rerio)
- All Figures
- Figures for Uribe-Montes et al., 2024
Image
|
Figure Caption
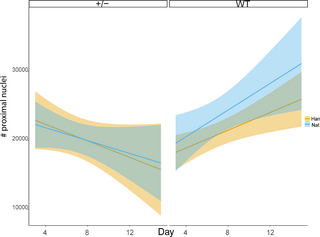
Fig. 9 Evaluation of proximal tubule nuclei along kidney regeneration days per tubule. The lines indicate the trend, and the colored shadows represent the 95% CI confidence interval. The opposite trends show significant differences between both carriers (+/) compared to both WT (P≤0.05) n = 3 (for each regeneration time, control and strain).
Figure Data
Acknowledgments
This image is the copyrighted work of the attributed author or publisher, and
ZFIN has permission only to display this image to its users.
Additional permissions should be obtained from the applicable author or publisher of the image.
Full text @ PLoS One