
- Title
-
BCL2L13 at endoplasmic reticulum-mitochondria contact sites regulates calcium homeostasis to maintain skeletal muscle function
- Authors
- Grepper, D., Tabasso, C., Zanou, N., Aguettaz, A.K.F., Castro-Sepulveda, M., Ziegler, D.V., Lagarrigue, S., Arribat, Y., Martinotti, A., Ebrahimi, A., Daraspe, J., Fajas, L., Amati, F.
- Source
- Full text @ iScience
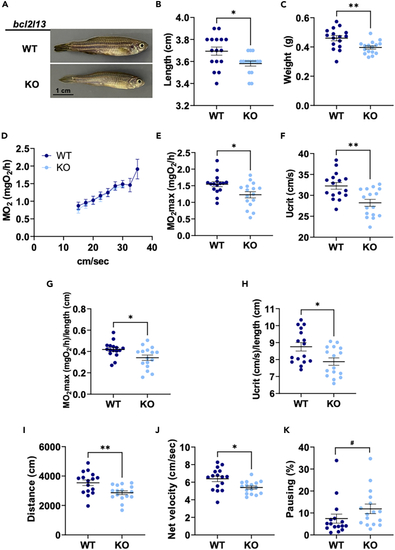
Phenotype and swimming capacity of (A) Representative image of adult male fish. (B) Length. (C) Weight. (D) Mean MO2 during the incremental exercise test. (E–H) MO2max and Ucrit in absolute values and normalized by length. (I–K) Outcomes of the spontaneous locomotion test. For all panels, See also |
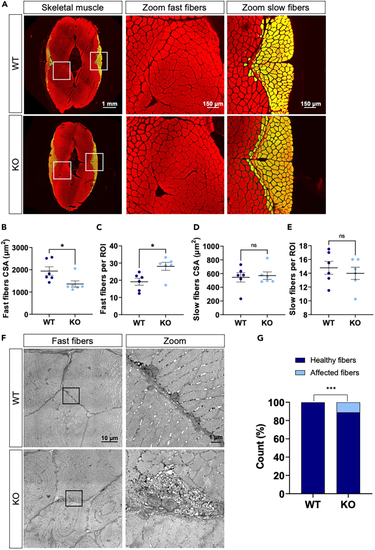
Skeletal muscle structure of WT and KO fish (A) Representative immunohistochemistry of transverse muscle sections of WT and KO fish stained with phalloidin (red). Slow fibers are marked with an antibody against MYH7B (green, merge is yellow). (B) Mean CSA of fast muscle fibers per fish. (C) Mean number of fast fibers per ROI per fish. (D) Mean CSA of slow muscle fibers per fish. (E) Mean number of slow fibers per ROI per fish. (F) Representative electron micrographs of fast muscle fibers of WT and KO fish. (G) Contingency graph for healthy fibers vs. fibers with SR accumulation. For (C–E) |
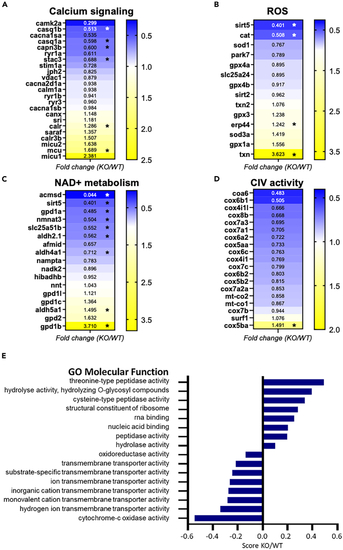
Skeletal muscle proteomics of KO and WT zebrafish (A–D) Fold change heat maps in selected proteins associated with different cellular functions. (E) Enrichment score KO/WT of significantly modified protein groups related to gene ontology molecular function (GOMF). The score is derived from 1D annotation enrichment analysis. See also |

Mitochondrial content, morphology and respiration in (A) Representative immunohistochemistry of transverse muscle sections of WT and KO fish stained with phalloidin (red). Mitochondria are marked with an antibody against MCTO1 (green, merge is yellow). (B) Mitochondrial area in fast muscle fibers. (C) Representative micrographs with ROI and mitochondria circling (yellow overlays) and zoomed section (black squares). (D–F) Analyses of IMF mitochondrial parameters. (G–K) Oxygen consumption rates normalized to mitochondrial content with Mitotracker Deep Red (OCR/MTDR). Black vertical lines indicate addition of substrates and electron transport chain (ETC) complexes inhibitors. (H–J) Mean ETC complex I activity (CI), complex II activity (CII), and complex IV (CIV) activity. For (D–F), See also |
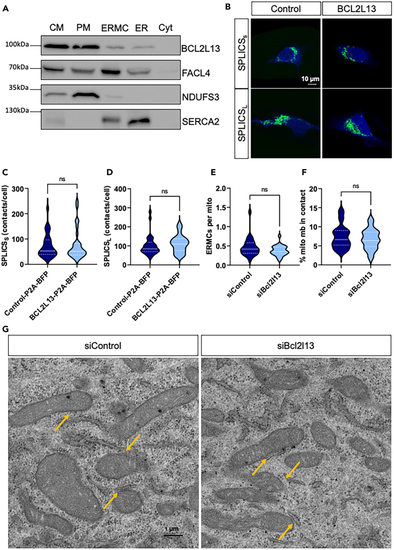
Subcellular localization of BCL2L13 and ERMCs quantifications (A) Representative western blot of isolated subcellular fractions. Expression of BCL2L13, FACL4, NDUFS3, and SERCA2 in crude mitochondria (CM), pure mitochondria (PM), EMRCs, ER, and cytosol (Cyt). Experiments were repeated 4 times. (B) Representative confocal microscopy images of HeLa cells expressing SPLICSS/L probes (green) and BFP from P2A constructs (blue). (C) Quantification of SPLICSS and (D) SPLICSL contacts in HeLa cells expressing control-P2A-BFP (Control) or BCL2L13-P2A-BFP (BCL2L13). (E) Number of ERMCs per mitochondria and (F) percentage of the mitochondrial membrane in contact with ERMCs (% mito mb in contact) measured in electron micrographs from siControl and siBCL2L13 transfected C2C12 myotubes. (G) Representative electron micrographs of C2C12 myotubes in siControl and siBCL2L13 transfected cells. Orange arrows indicate examples of ERMCs. See also |
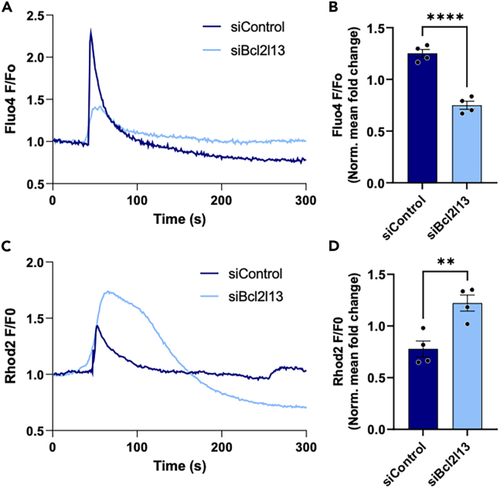
Ca2+ dynamics in siBCL2L13 and siControl C2C12 myotubes (A) 300 s confocal time-lapse recording of cytosolic Ca2+ levels. (B) Quantification of normalized Fluo-4 fluorescence in response to 2.5 mM caffeine. (C) 300 s confocal time-lapse recording of mitochondrial Ca2+ levels. (D) Normalized Rhod-2 fluorescence in response to 1 μM thapsigargin. (A–D) See also |