
- Title
-
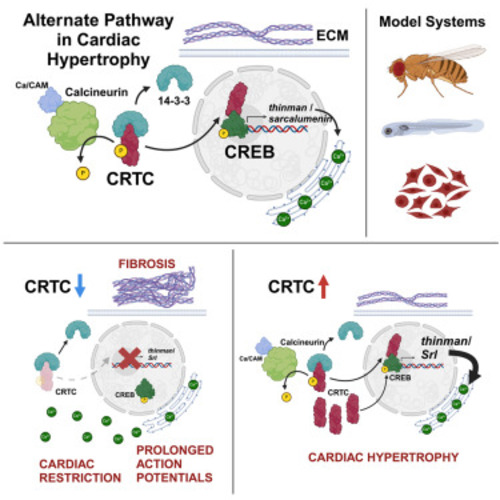
The nutrient sensor CRTC and Sarcalumenin/thinman represent an alternate pathway in cardiac hypertrophy
- Authors
- Dondi, C., Vogler, G., Gupta, A., Walls, S.M., Kervadec, A., Marchant, J., Romero, M.R., Diop, S., Goode, J., Thomas, J.B., Colas, A.R., Bodmer, R., Montminy, M., Ocorr, K.
- Source
- Full text @ Cell Rep.

CRTC KO causes cardiac dysfunction and fibrosis that are mimicked by CREB KO (A) (Left) KO of CRTC significantly reduced end diastolic diameter (EDD) in hearts from both heterozygous (−/+) and homozygous (−/−) mutants compared to genetic background controls (w1118). (Right) Similar cardiac restriction was observed in hearts from CREB−/+ heterozygotes. (B) (Left) Fractional shortening was reduced in hearts from CRTC−/− mutants and (right) in CREB−/+ heterozygotes. (C) (Left) Heart period (one contraction cycle) was reduced in CRTC-KO flies, but not in CRTC heterozygotes. (Right) CREB−/+ heterozygote flies also showed significant reductions in HP. (D) (Left) Cardiac output was significantly reduced in CRTC−/− mutants and (right) in CREB−/+ heterozygotes. (For A–D, flies were 1 week of age; p values by one-way ANOVA for CRTC mutants and two-tailed, unpaired t tests for CREB mutants; plots show all data points, max, min, median, and p values.) (E) F-actin staining with phalloidin reveals the cardiac tube and (E′) tightly packed circumferential fibers (arrowhead) in an optical section from a single chamber in a control. (Asterisks denote position of ostia, anterior is left.) (E″) Control stained for collagen IV (pericardin) reveals the extensive extracellular matrix that surrounds the heart. (F) F-actin staining in a CRTC mutant exhibiting cardiac restriction and (F′) disorganized myofibrils (arrowheads); ostia are also malformed (asterisks). (F″) The collagen matrix in CRTC−/− mutants is significantly expanded, especially in the posterior region (right). (G) Cardiac chamber from a CREB heterozygote mutant showing cardiac restriction and (G′) disorganized myofibrils with gaps (arrowheads) and malformed ostia (asterisks). (G″) Collagen network in the CREB−/+ heterozygotes is expanded, especially in the posterior region (right). (For E–G″, scale bars represent 40 μm). (H) Quantification of collagen area normalized to cardiac actin area is increased in CRTC mutants compared to controls at 1 week (p values by two-tailed, unpaired t tests). (I and I′) Immunohistochemistry shows nuclear CRTC localization in cardiomyocytes (arrowheads, CRTC staining is green, nuclear staining is blue). (J and J′) Co-staining of non-myocardial ventral longitudinal fibers with CRTC and α-actinin antibodies shows CRTC (green) strongly associated with α-actinin in Z bands (magenta). (K–M) Optical sections through one chamber of the heart stained for CRTC (K, green), α-actinin (L, magenta), and (M) merged image. (K′-M′) Higher magnification of regions in yellow rectangles. Arrows show location of anti-CRTC staining (K′), α-actinin staining (L′), and co-localization (M′, white). (For I–M′, scale bars represent 20 μm). |
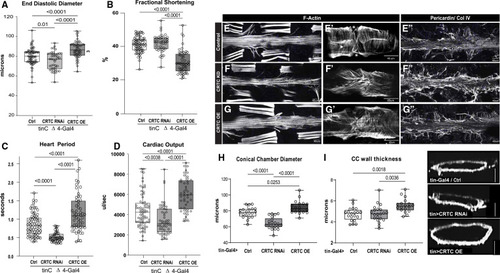
The effects of CRTC are cardiac autonomous (A) Cardiac-specific CRTC KD with tinCΔ4-Gal4 significantly reduced EDD, while cardiac CRTC OE increased EDD, compared to controls (tinCΔ4-Ga4/+). (B) Fractional shortening was significantly reduced by cardiac CRTC OE. (C) Heart period was significantly reduced in CRTC-KD hearts and increased in hearts with CRTC OE. (D) Cardiac output was reduced in CRTC-KD hearts and increased in hearts with CRTC OE. All flies were 3 weeks of age; plots show all data points, max, min, median, and p values; significance by one-way ANOVA with Tukey’s multiple comparisons post hoc test. (E–G) (E) F-actin staining shows sarcomeric structure in cardiac tubes and adjacent body wall muscles. (E′) Optical section through one cardiac chamber showing the tightly packed, circumferential fibers (arrowhead) in a control heart. (Asterisk denotes position of the ostia, anterior is left in all pictures.) (F) F-actin staining of a heart with cardiac CRTC KD, exhibiting cardiac restriction and (F′) disorganized myofibrils with malformed ostia. (G) Cardiac CRTC-OE heart showing cardiac dilation and (G′) some disorganized myofibrils and gaps and malformed ostia. (E″) Wild-type control stained for collagen IV (pericardin) reveals the extensive extracellular matrix. (F″) The collagen matrix in CRTC KD is expanded, especially in the posterior heart (right), but (G″) not with CRTC OE. (For E–G″, scale bars represent 40 μm). (H) Diameters from optical sections of dystroglycan-stained hearts. Cardiac conical chamber (CC) diameters were significantly reduced with cardiac CRTC KD and increased with cardiac CRTC OE. (I) Cardiomyocyte thickness, measured from optical sections of dystroglycan-stained hearts (to the right, scale bar represents 50 μm), was increased with cardiac CRTC OE compared to control and cardiac CRTC-KD hearts. |

Hypertrophic effects of Calcineurin/Pp2B are rescued by reductions in CRTC (A) (Left) EDD was reduced in hearts from cardiac-specific CRTC KD and CRTCdeficiency/− mutants compared to genetic background controls. Constitutive cardiac Pp2B OE increased EDD, which was progressively rescued in CRTCdef/+ (heterozygous) and CRTCdef/− (homozygous) mutant backgrounds. (Right) Cardiac-specific CRTC OE caused a significant increase in EDD, as for cardiac Pp2B OE. (B) (Left) Fractional shortening increased with cardiac-specific Pp2B OE but was unaffected by reduced CRTC expression. (Right) CRTC OE caused a reduction in fractional shortening compared to genetic background controls. (C) (Left) Cardiac-specific CRTC KD caused tachycardia (shorter heart periods), whereas Pp2B OE caused bradycardia (longer heart periods) that was progressively reversed by reducing CRTC expression. (Right) CRTC OE caused bradycardia compared to genetic background controls. (D) (Left) Cardiac output was again reduced in response to cardiac-specific CRTC KD. (Right) Output was increased by cardiac CRTC OE. (For A–D, plots show all data points, max, min, median, and p values; significance by one-way ANOVA with Tukey’s multiple comparisons post hoc test). (E–H) HCR was used to examine expression of the hypertrophic marker Mhc (myosin heavy chain) in the fly heart. (E) Mhc expression in the control heart is uniformly distributed along the tube, (E′) in the myocardial cells of a single chamber, and (E″) in an optical cross section of the heart. (F) Mhc expression is slightly reduced in CRTC mutant heart, (F′) in the myocardial cells, and (F″) in an optical cross section. (G) Mhc expression is dramatically increased in the CRTC OE heart, (G′) in the thickened myocardial cells, and (G″) in a myocardial cell cross section. (H) Mhc expression is dramatically increased in the Pp2B OE heart, (H′) in the thickened myocardial cells, and (H″) in a myocardial cell cross section. (I–K) Arginine kinase (Argk) is the fly ortholog of creatine kinase, a marker for cardiac damage. (I) Argk expression was uniformly distributed in the control heart, (I′) in myocardial cells, and (I″) in the cardiac tube cross section. (J) Argk expression was slightly reduced in the CRTC mutant heart, (J′) in the myocardial cells, and (J″) in the cardiac tube cross section. (K) Argk expression was dramatically increased in the CRTC-OE heart, (K′) in the myocardial cells, and (K″) in the cross section. (For E–K″, all images were taken with the same exposure settings; scale bars represent 40 μm). |

CRTC affects cardiac structure and function in zebrafish (A) Hearts from 72 hpf zebrafish were stained for myosin (MF20, red) and CRTC (white). Scale bar, 40 μm. (A′) Magnified inset from (A) showing significant nuclear localization of CRTC. (A″) CRTC also showed a distinct banded structure in cardiomyocytes (arrowheads; scale bar, 5 μm). (A‴) Myosin staining showing cardiac myofibrils. The position of CRTC staining in A″ is shown by arrowheads and appears to localize between bands of myosin staining. Scale bar, 5 μm. (B) CRTC3 morpholino-KD hearts stained for myosin (MF20, red) and CRTC (white; note that all images in the CRTC channel were significantly overexposed). Scale bar, 40 μm. (B′) Magnified inset from (B) showing some residual CRTC in nuclei. (B″) CRTC staining in the morpholino heart was reduced and diffuse and did not show any structure pattern. Scale bar, 5 μm. (B‴) Myosin staining showing cardiac myofibrils. Scale bar, 5 μm. (C and D) Images of (C) control (DMSO injected) and (D) CRTC-KD fish at 72 hpf show normal development of body-wall muscle and fins (arrows). (E) End diastolic surface area of hearts in 72 hpf fish was significantly reduced in atria and especially in the ventricles, following MO KD of CRTC3. (D) End systolic surface area in ventricles was also significantly reduced. (For D and E, plots show all data points, max, min, median, and p values; significance by two-way unpaired t test). |

Cardiac CRTC KD and OE concertedly regulate metabolism in the heart (A) Venn diagram showing up- and downregulated genes in response to cardiac-specific KD or OE of CRTC. Bolded numbers in the center represent genes that are concertedly regulated by CRTC; 106 are DOWN with CRTC OE and UP with CRTC KD, 34 are UP with CRTC OE and DOWN with CRTC KD. (B) Significantly affected GO categories for the 140 concertedly regulated genes are primarily pathways involved in metabolic regulation. (“Count” indicates the number of genes affected in the GO category). (C) Whole-body triglyceride levels were significantly reduced in CRTC systemic mutant flies (left) and were also significantly reduced in cardiac-specific CRTC-KD flies (right). Ctrl1 flies were w1118 and Crtl2 flies were tinCD4-Ga4/+. (Plots show all data points, max, min, median, and p values; significance by unpaired t test [left] and one-way ANOVA with Tukey’s multiple comparisons post hoc test [right]). |
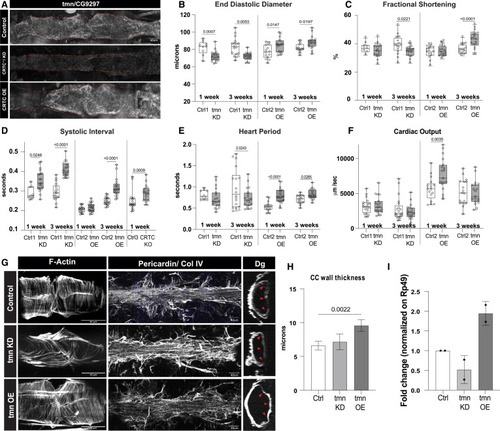
CG9297/thinman is regulated by CRTC in the heart (A) HCR in Drosophila hearts shows that tmn (CG9297)/Srl is ubiquitously expressed in control hearts (tinCΔ4-Ga4/+); expression was significantly reduced in the CRTC mutant and KD hearts, while expression was increased in CRTC-OE hearts. Scale bar, 40 μm (B) (Left) EDD was significantly reduced in response to cardiac tmn/Srl KD at both 1 and 3 week of age compared to controls. (Right) EDD was significantly increased in response to cardiac tmn/Srl OE at both 1 and 3 week of age compared to controls. (For B–F, Crtl1 flies were tinCΔ4-Ga4/+ [GD Cntrl], Ctrl2 flies were tinCΔ4-Ga4/w1118, and Ctrl3 flies were w1118). (C) (Left) Fractional shortening was reduced by cardiac tmn/Srl KD at 3 week of age compared to controls (+). (Right) Fractional shortening increased in response to cardiac tmn/SRL OE at 3 week of age compared to controls. (D) (Left) Systolic intervals are increased in response to cardiac tmn/Srl KD at both 1 and 3 week of age compared to wild-type controls (+). (Middle) Systolic intervals are increased in response to cardiac tmn/SRL OE at 3 week of age compared to controls. (Right) Systolic intervals in fly hearts are increased in response to cardiac-specific KO of CRTC at 1 week of age compared to controls. (E) (Left) Heart period was decreased in response to cardiac tmn/Srl KD at 3 week of age compared to controls (+). (Right) Heart period was also significantly increased in response to cardiac tmn/Srl OE at both 1 and 3 week of age compared to controls. (F) (Left) Cardiac output was not significantly affected by cardiac tmn/Srl KD. (Right) Cardiac output was significantly increased in response to cardiac tmn/Srl OE at 1 week of age. (Plots show all data points, max, min, median, and p values; significance by one-way ANOVA with Tukey’s multiple comparisons post hoc test.) (G) Compared to the closely packed myofibrils in controls (top), F-actin staining shows disorganized myofibrils in tmn/Srl-KD hearts (middle), but relatively normal circumferential myofibrillar arrangement in tmn/Srl-OE hearts (bottom). Anti-pericardin (collagen IV) staining shows a more extensive collagen network surrounding the tmn/Srl-KD heart compared to control. Dystroglycan staining followed by optical sectioning showed an increased thickness in tmn/Srl-OE hearts, especially noticeable at arrowheads. (Dorsal is right, ventral is left.) (For G–I, control flies were tinCΔ4-Ga4/+). Scale bars, 40 μm. (H) Myocardial cell thickness, made at three points along the heart tube (red arrowheads in G), was significantly increased by cardiac-specific tmn/Srl-OE. (Significance by one-way ANOVA and Tukey’s multiple comparisons post hoc test; p value shown). (I) RT-qPCR quantification of tmn expression in isolated hearts from genetic background controls (+) and cardiac tmn-KD and -OE hearts. (Normalized to ribosomal protein 49, two biological replicates in triplicate). |
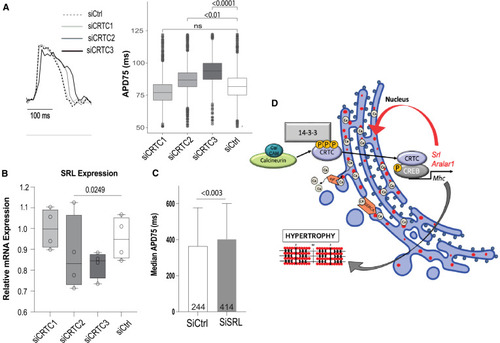
CRTC affects cardiac function in hiPSC-cardiomyocytes (A) Representative voltage traces from control siRNA- and siCRTC-transfected cardiomyocytes. APs were recorded optically from individual cardiomyocytes. APD at 75% of repolarization (APD75) was significantly increased with siRNA-mediated KD of CRTC2 and CRTC3. (Plots show max, min, median, and p values; siCtrl n = 1,338, siCRTC1 n = 1,459, siCRTC2 n = 1,427, siCRTC3 n = 1,326; significance by one-way ANOVA with Tukey’s multiple comparisons post hoc test). (B) RT-qPCR quantification showing reduction in SRL expression in iPSC-CMs after siRNA CRTC KD. (Significance by one-way ANOVA with Tukey’s multiple comparisons post hoc test). (C) siRNA KD of SRL prolongs APD75 in hiPSC-CMs (unpaired t test). (D) Model of proposed CaN-CRTC-SRL signaling pathway. |
|