
|
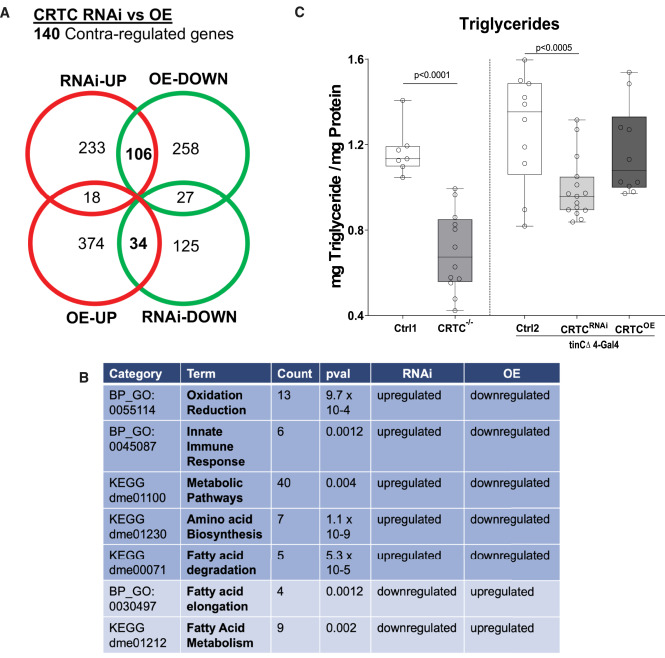
Fig. 5 Cardiac CRTC KD and OE concertedly regulate metabolism in the heart (A) Venn diagram showing up- and downregulated genes in response to cardiac-specific KD or OE of CRTC. Bolded numbers in the center represent genes that are concertedly regulated by CRTC; 106 are DOWN with CRTC OE and UP with CRTC KD, 34 are UP with CRTC OE and DOWN with CRTC KD. (B) Significantly affected GO categories for the 140 concertedly regulated genes are primarily pathways involved in metabolic regulation. (“Count” indicates the number of genes affected in the GO category). (C) Whole-body triglyceride levels were significantly reduced in CRTC systemic mutant flies (left) and were also significantly reduced in cardiac-specific CRTC-KD flies (right). Ctrl1 flies were w1118 and Crtl2 flies were tinCD4-Ga4/+. (Plots show all data points, max, min, median, and p values; significance by unpaired t test [left] and one-way ANOVA with Tukey’s multiple comparisons post hoc test [right]).